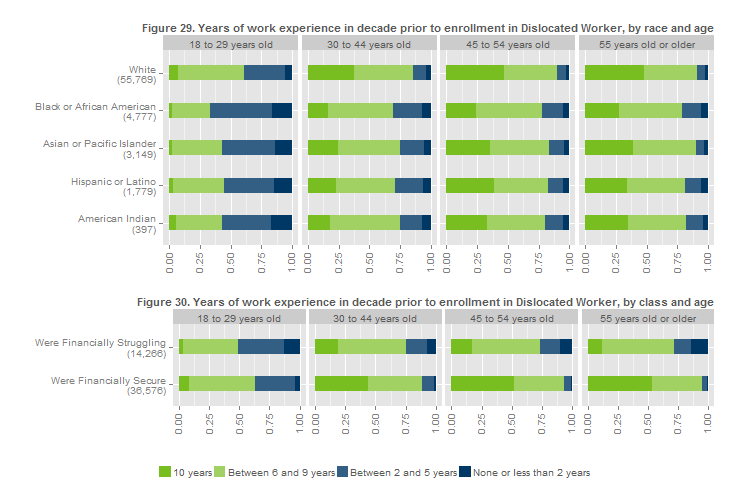
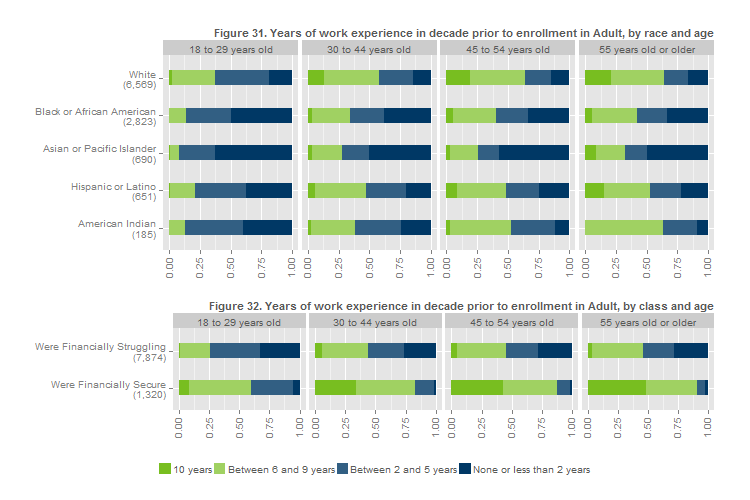
Figures 29 through 32 show the number of years participants worked in the decade prior to enrollment. '10 years' implies a perfect work history, at least for the previous decade. Because years of work experience are directly impacted by age, we show results by age cohort.

The starkest disparity appears by class (Figures 30 and 32). Those who were financially secure have much higher rates of consistent employment in the previous decade (reaching 50% or even more among older participants) than those who were financially struggling (whose rates are less than 20%).
Among Dislocated Worker participants, racial disparities are less pronounced. The largest disparity in rates of ’10 years’ of work experience among Dislocated Worker participants, especially among older cohorts, is that between Black or African American and white participants (Figure 29).
Asian or Pacific Islander and Black or African American participants in the Adult program have high rates of ‘None or less than 2 years’ of work experience. Given the large proportion of Asian or Pacific Islander Adult program participants with limited English skills (see the section Limited English Skills), this could reflect rates of recent immigration.
Of course, a lack of work experience and long term unemployment are well-known barriers to employment, particularly relevant for this group (See Note 1).
