by Mark Schultz
February 2021
Workers in Southeast Minnesota perform a wide variety of critical duties, such as providing medical services, caring for the elderly, repairing cars, assisting with legal issues, and serving us food, just to name a handful. Especially during the uncertain times created by the COVID-19 pandemic, these workers have proved how critical they are.

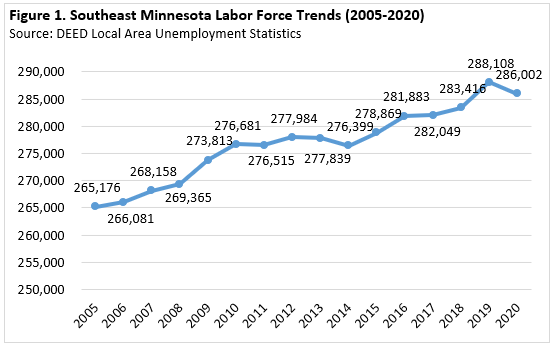
The number of available workers in Southeast Minnesota has, for the most part, seen a steady increase since 2005, jumping by almost 21,000 people during this 15-year period, an increase of 7.9%. A couple of small dips occurred from 2010 to 2011 and 2013 to 2014, followed by a much larger COVID-19 induced decline from 2019 to 2020. During the drop seen in the last year, the number of labor force participants decreased by just over 2,100, a drop of 0.7% (see Figure 1).
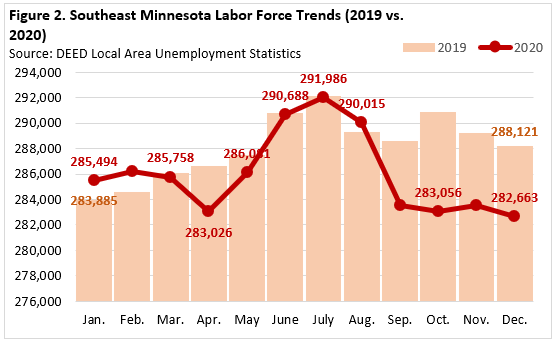
In addition to growing year over year, the region's labor force typically also grows from January through December. In 2019 the labor force grew by 4,236 workers over the course of the year, peaking at 292,052 workers in July. The last time the region lost workers from January to December was in 2013. But 2020 was different in many ways. The onset and persistence of the COVID-19 pandemic has thrown Southeast Minnesota's labor force through a whirlwind of change over the last year.

In 2020 the labor force contracted from 285,494 participants in January to 282,663 participants in December, a 1% drop. In between, however, the labor force was on a rollercoaster ride, dropping to a low of 283,026 people in April then peaking at 291,986 in July for an increase of almost 9,000 participants or 3.2%.
In the three months that followed, the labor force took another hit and began to decline rapidly, losing almost all the labor force members it gained from April to July, dropping by 8,930 workers or 3.1%. Since that point, the labor force count remained rather steady, until it experienced another decline from November to December as the second round of executive orders hit the region, leading to a decrease of just over 900 labor force participants (see Figure 2).
The labor force is classified into two groups of people – the employed and unemployed – according to the Bureau of Labor Statistics. Also according to DEED's Local Area Unemployment Statistics, employed individuals include people who are 16 years of age and over who worked for pay or profit, or did unpaid work in a family-operated business, or were temporarily absent from their regular jobs. This includes self-employed and payroll workers. It is a count of people, not jobs, and depends on the residence of the worker, not where the job is located.
On the other hand, unemployed persons refers to those who are not employed but who are available for work and were actively looking during the previous four weeks, as well as those waiting to be called back to a job from which they were laid off, or people waiting to report to a new job. This does not include people who are not in the labor force – people who are not seeking work for various reasons including being voluntarily retired, a student taking classes, or a family member looking after dependents.

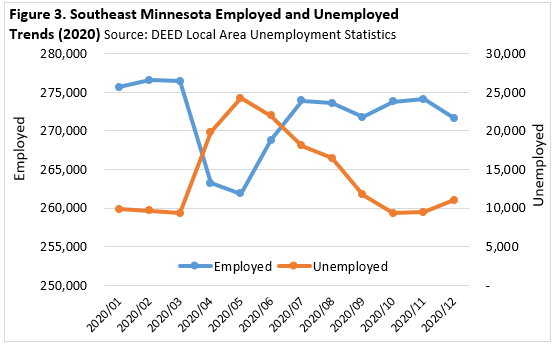
These groups of people – the employed, the unemployed, and those not in the labor force – also saw wild fluctuations since the onset of COVID-19. Over the year the number of employed people in the Southeast region dropped by over 4,000 individuals for a loss of 1.5%. At the same time the number of unemployed individuals increased by over 1,200, a leap of 12.4%. The number of people who dropped out of the labor force neared 5,500 compared to December of 2019.
The number of employed people peaked in February at 276,563 participants. After seeing a month of minor decline, the number of employed individuals then saw two months of major declines, reaching its deepest valley in May at 261,848, a decline of just over 14,700 or 5.3% since the February peak. Things started to look up for the number of employed individuals as the subsequent two months brought about large increases to the tune of over 12,000 additional employed individuals. To close out the year, the number of employed individuals remained relatively steady, experiencing minor declines in September and another decline from November to December as the second round of COVID-19-related closures and limitations hit the region (see Figure 3).
At the same time the number of employed individuals was dropping and experiencing the deepest low, the number of unemployed individuals experienced massive increases and a peak in May. From March to May the number of unemployed individuals increased by 14,923 people, an unprecedented increase of 160%. After this peak, the number of unemployed individuals began a consistent decline, dropping by 14,930 individuals from May to October, a decline of 61.6%, also reaching its lowest count during the entire year at 9,303 unemployed persons. As the second wave of closures and limitations hit the region, the number of unemployed workers began to increase again during the remaining two months of the year.
Table 1 outlines the composition of the region's labor force by age, race and Hispanic origin, disability status, and educational attainment, using data from the Census Bureau's 2015-2019 American Community Survey 5-year Estimates. While they may seem a little outdated now, especially with all the changes seen over the past year, this is the most recent and accurate data available on the demographics of the region's labor force.
The largest proportion of labor force participants in Southeast Minnesota are between the ages of 25 and 44, with this age group making up almost 40% of the total labor force, followed by a nearly-as-large-representation of participants between the ages of 45 to 64. Interestingly, both teenagers and senior citizens make up 5.7% of the regional labor force.
Although it has been changing over time, the region's labor force is relatively racially non-diverse, with over 90% of workers identifying as white. At 5.0%, the largest minority group in the labor force are of Hispanic or Latino origin, followed by Asians or Other Pacific Islanders and Black or African American workers, both representing around 3% of the region's workforce. Workers of some other race or two or more races each comprise about 1.5% of the labor force.
For workers between 25 and 64 years of age, nearly three quarters have at least some college or a postsecondary degree, including 35% with a bachelor's degree or higher. Just 5% have less than a high school diploma, and about 24% have a high school diploma or equivalent. Southeast Minnesota has a well-educated workforce, especially in the younger age groups.
The region also has more than 13,000 workers between the ages of 20 and 64 with a disability, accounting for 5.4% of that age cohort. However, at 56.3%, workers with a disability have much lower labor force participation rates than the overall population and at 7.4% also had much higher unemployment rates.
More than the disabled have low labor force participation rates, high unemployment rates, or a combination of both, such as seen among the youngest age cohort, Blacks and African Americans and American Indian and Alaska Natives, those with less than a high school diploma, and people with disabilities (see Table 1).Many employers are still straining to find workers to fill their open positions, so efforts could be increased to hire from these groups that seem to be struggling in the labor force.
Table 1. Southeast Minnesota Employment Characteristics (2019)
| - | Southeast Minnesota | Minnesota | ||||
|---|---|---|---|---|---|---|
| In Labor Force | Percent of Total Labor Force | Labor Force Participation Rate | Unemployment Rate | Labor Force Participation Rate | Unemployment Rate | |
| Total Labor Force | 276,312 | 100.0% | 68.6% | 3.6% | 69.7% | 3.6% |
| 16 to 19 years | 15,617 | 5.7% | 57.0% | 14.4% | 53.2% | 11.0% |
| 20 to 24 years | 29,159 | 10.6% | 84.5% | 4.9% | 84.6% | 6.0% |
| 25 to 44 years | 108,508 | 39.3% | 88.4% | 3.6% | 88.8% | 3.2% |
| 45 to 54 years | 55,337 | 20.0% | 89.0% | 3.0% | 87.6% | 2.7% |
| 55 to 64 years | 51,929 | 18.8% | 75.0% | 2.5% | 73.0% | 2.8% |
| 65 to 74 years | 13,032 | 4.7% | 27.7% | 3.7% | 27.9% | 2.2% |
| 75 years & over | 2,676 | 1.0% | 6.8% | 6.7% | 6.6% | 2.4% |
| Employment Characteristics by Race & Hispanic Origin | ||||||
| White alone | 250,219 | 90.6% | 68.5% | 3.0% | 69.3% | 3.0% |
| Black or African American | 8,072 | 2.9% | 66.4% | 15.3% | 71.3% | 8.8% |
| American Indian and Alaska Native | 874 | 0.3% | 57.6% | 18.7% | 58.9% | 12.6% |
| Asian or Other Pac. Islanders | 8,906 | 3.2% | 72.1% | 5.8% | 71.2% | 4.3% |
| Some Other Race | 4,409 | 1.6% | 75.7% | 8.1% | 77.7% | 6.1% |
| Two or More Races | 3,786 | 1.4% | 71.3% | 8.7% | 73.6% | 7.4% |
| Hispanic or Latino | 13,740 | 5.0% | 74.4% | 8.2% | 76.5% | 6.1% |
| Employment Characteristics by Disability | ||||||
| With Any Disability, 20 to 64 years | 13,112 | 5.4% | 56.3% | 7.4% | 53.0% | 8.6% |
| Employment Characteristics by Educational Attainment | ||||||
| Population, 25 to 64 years | 215,755 | 78.1% | 84.9% | 2.6% | 84.5% | 3.0% |
| Less than H.S. Diploma | 10,988 | 5.1% | 68.2% | 3.9% | 66.3% | 4.2% |
| H.S. Diploma or Equivalent | 51,371 | 23.8% | 80.3% | 2.7% | 78.5% | 2.6% |
| Some College or Assoc. Degree | 78,487 | 36.4% | 86.8% | 2.3% | 85.3% | 3.0% |
| Bachelor's Degree or Higher | 74,917 | 34.7% | 89.5% | 1.1% | 90.0% | 1.7% |
| Source: 2015-2019 U.S. Census American Community Survey | ||||||
Southeast Minnesota's labor force endured quite the shock in 2020, when the onset and persistence of the COVID-19 pandemic threw "normal" out the window. Unprecedented changes occurred in the labor force as the number of employed people saw decreases and the number of unemployed individuals saw increases, while other participants simply dropped out of the labor force.
This changing labor market landscape has made hiring difficult for many employers. As fear of the virus increased and spread, some workers were less willing to return to work or find alternative employment. Understanding the opportunities to draw workers back into the labor force and which groups could be recruited from will help employers reduce some of these struggles.