by Nick Dobbins
February 2018
Monthly analysis is based on seasonally adjusted employment data. Yearly analysis is based on unadjusted employment data.*
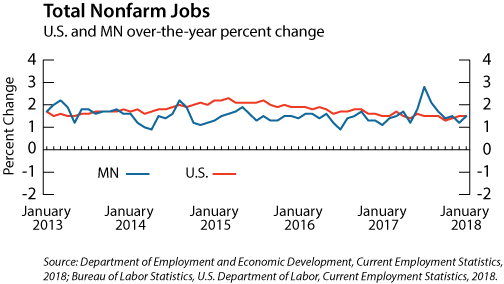
Employment in the Minneapolis-St Paul MSA was down by 37,347 (1.9 percent) in January. Job losses of this magnitude and greater are common in January, as the holiday season ends and related jobs disappear. Trade, Transportation, and Utilities lost 11,419 jobs (3.1 percent) with the component Retail Trade sector losing 6,870 (3.5 percent). The largest proportional decline came in another seasonal industry. Mining, Logging, and Construction, lost 6,638 jobs (8.7 percent). Also worth noting, the Professional and Business Services supersector lost 9,254 jobs (2.9 percent), with losses coming in all three component sectors. Every single supersector in the MSA lost jobs on the month. Annually the metro area added 12,979 jobs (0.7 percent). It was the first time that over-the-year job growth in the metro dipped below 1 percent since June of 2016. Three supersectors shed jobs on the year: Professional and Business Services (down 3588 or 1.1 percent), Leisure and Hospitality (down 49, 0 percent), and the long-struggling Information supersector (down 686, 1.8 percent). The largest growth industry in both total and proportional employment was Government (up 6,001 jobs or 2.4 percent).
The Duluth MSA lost 2,291 jobs (1.7 percent) in January. As was the case in the Minneapolis-St. Paul metro, every published supersector lost jobs on the month. Mining, Logging, and Construction had the steepest decline, off by 4.7 percent (416 jobs) from January estimates. Trade, Transportation, and Utilities lost the most jobs, down 706 (2.8 percent). Over the year the Duluth MSA added 1,715 jobs (1.3 percent). After lagging behind the statewide rate since June of 2016, over-the-year growth in the MSA has now outpaced statewide growth for two consecutive months. Mining, Logging, and Construction added 482 jobs (6.1 percent), Educational and Health Services added 442 (1.4 percent), and Government employers added 432 (1.6 percent). Information had the sharpest decline (down 5.5 percent). In spite of being the smallest supersector in the MSA with just 1,326 jobs, it also had the area’s largest number of actual jobs lost, 77.
Employment in the Rochester MSA was down by 3,218 (2.7 percent) in January. This was the largest proportional over-the-month decline in the State, tied with St. Cloud. However, two supersectors added jobs in January, Manufacturing (up 221 jobs or 2.1 percent) and Information (which added one job). Mining, Logging, and Construction lost 511 jobs or 11.7 percent, while Educational and Health Services lost 1,760 or 3.5 percent. Over the year the Rochester area added 336 jobs (0.3 percent). Gains were driven in large part by the increase in Leisure and Hospitality (up 588 jobs or 6 percent). The next largest increase came in Government employment, which added 240 jobs or 1.9 percent. The most noteworthy losses came in Educational and Health Services, which also shed 516 jobs or 1.1 percent.
The Saint Cloud MSA lost 2,967 jobs (2.7 percent) in January, tying it with Rochester for the largest over-the-month decline in the state. As was the case in multiple MSAs, employment in every published supersector declined on the month. Mining, Logging, and Construction lost 684 jobs (11 percent), Trade, Transportation, and Utilities lost 923 (4.1 percent), and Professional and Business Services lost 882 (9.9 percent). Annually the Saint Cloud MSA added 262 jobs (0.2 percent). Educational and Health Services added 675 jobs (3.1 percent), and Manufacturing added 404 (2.7 percent), but gains were offset by losses in Trade, Transportation, and Utilities (down 553 or 2.5 percent) and Professional and Business Services (off by 594 or 6.9 percent).
The Mankato-North Mankato MSA lost 773 jobs (1.3 percent) in January. Public sector employers added 88 jobs (0.9 percent), but this was more than made up for with a loss of 1,353 jobs (2.9 percent) in the private sector. The Mankato area added 1,636 jobs or 2.9 percent on the year. This was the largest proportional over-the-year increase in Minnesota. Private sector employers added 1,353 jobs (2.9 percent), and public sector employers added 283 (3 percent). Goods producers added 321 jobs (3.3 percent), and service providers added 1,315 (2.8 percent).
The Fargo-Moorhead MSA lost 3,261 jobs (2.3 percent) in January. Trade, Transportation, and Utilities lost 728 jobs (2.4 percent), and Mining, Logging, and Construction lost 646 (7.9 percent). Every published supersector in the MSA lost jobs on the month. Annually the MSA lost 274 jobs (0.2 percent). Educational and Health Services added 821 jobs (3.5 percent). Leisure and Hospitality lost 630 jobs (4.7 percent), and Trade, Transportation, and Utilities lost 397 jobs (1.3 percent). Fargo-Moorhead and Grand Forks-East Grand Forks were the only MSAs in Minnesota to have negative over-the-year employment growth.
The Grand Forks-East Grand Forks MSA lost 1,013 jobs (1.8 percent) in January. Mining, Logging, and Construction shed 2223 jobs (8.1 percent), and Trade, Transportation, and Utilities lost 465 (3.9 percent). Annually the Grand Forks-East Grand Forks MSA lost 572 jobs (1 percent). That represents the largest over-the-year decrease in the state, as most metros added jobs on the year. Leisure and Hospitality drove the losses, off by 702 jobs (11.2 percent).
