by Nick Dobbins
January 2017
Monthly analysis is based on unadjusted employment data.
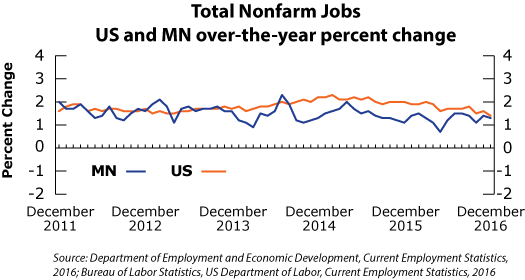
Employment in the Minneapolis-St Paul MSA decreased by 10,557 (0.5 percent) in December. The largest employment declines were found in the expected industries for a cold-weather job loss, as Mining, Logging, and Construction shed 7,428 jobs (down 9.2 percent), and Leisure and Hospitality lost 4,063 (2.3 percent). Movements were smaller in the remaining supersectors, with the next largest over-the-month changes in Other Services, which added 511 jobs (up 0.6 percent) and Government, which lost 1,460 (down 0.6 percent) thanks in large part to the loss of 1,573 jobs (3.4 percent) from State Government Educational Services. Employment declines are normal for the area in December. 2005 was the last time the MSA didn’t lose jobs for the month. Annually the Minneapolis-St. Paul area added 27,693 jobs (1.4 percent). The largest sources of job growth for the area remained the Professional and Business Services supersector (up 12,783 or 4.2 percent) and the Educational and Health Services supersector (up 12,974 or 4 percent). Growth in Educational and Health Services was spurred primarily by Health Care and Social Assistance, which added 12,244 jobs (4.5 percent) on the back of an additional 8,384 jobs (9.5 percent) in component Ambulatory Health Care Services. The most notable loss came from Leisure and Hospitality, which shed 5,263 jobs (3 percent) since December of 2015. This is a fairly large change from November’s over-the-year estimate, which had the supersector losing just 1,416 jobs (0.8 percent) over the prior year.
The Duluth-Superior MSA lost 1,769 jobs (1.3 percent) in December. Mining, Logging, and Construction lost 306 jobs (3.5 percent), Professional and Business Services lost 389 (4.6 percent), Educational and Health Services lost 450 (1.4 percent), Leisure and Hospitality lost 316 (2.4 percent), and Government employers lost 202 (0.8 percent). Over the year, employment in the Duluth area was generally relatively flat as the MSA added 254 jobs (0.2 percent), a markedly slower growth rate than the state’s 1.3 percent. The largest increases came in Leisure and Hospitality (up 565 jobs or 4.6 percent), Educational and Health Services (up 357 or 1.1 percent), and Financial Services (up 109 or 1.9 percent). Notable losses came in Trade, Transportation, and Utilities (down 554 jobs or 2.1 percent) and Manufacturing (down 124 or 1.8 percent).
Employment in the Rochester MSA was down by 529 (0.4 percent) in December, the fourth straight month of job losses for the area. Notable losses came in Mining, Logging, and Construction (down 473 or 9.8 percent), Trade, Transportation, and Utilities (down 173 or 0.9 percent), and Professional and Business Services (down 70 or 1.2 percent). Government employers had the most proportional and actual over-the-month growth, adding 136 jobs,or 1.1 percent. Annually the Rochester MSA added 3,031 jobs (2.6 percent). Educational and Health Services accounted for 1,533 new jobs (up 3.3 percent). Notable over-the-year growth also occurred in Leisure and Hospitality (up 430 or 4.6 percent), Professional and Business Services (up 241 or 4.3 percent), and Trade, Transportation, and Utilities (up 626 or 3.4 percent).
Employment in the St. Cloud metropolitan statistical area was flat in December, as the MSA lost just 20 jobs (0 percent) in a month where employment declines are common. Mining, Logging, and Construction shed 455 jobs (6.3 percent), and Professional and Business Services lost 216 (2.4 percent). These losses were largely countered by a gain of 511 jobs (2.2 percent) in Educational and Health Services, as well as a gain of 157 jobs (1.1 percent) in Trade, Transportation, and Utilities. Annually the St. Cloud area added 2,491 jobs (2.3 percent). Repeating a similar story from around the state, the largest number of new jobs appeared in Educational and Health Services, which added 1,715 jobs (8 percent). Mining, Logging, and Construction (up 613 or 9.9 percent), and Financial Activities (up 139 or 2.8 percent).
Employment in the Mankato-North Mankato MSA was down by 477 (0.8 percent) in December. Goods Producers lost 200 jobs (2 percent) while Service Providers lost 247 (0.5 percent). Most of the monthly losses were concentrated in the private sector, which shed 434 jobs (0.9 percent) while public sector employers lost only 13 jobs (0.2 percent). Annually the Mankato MSA added 56 jobs (0.1 percent). This was the slowest annual growth rate of any of the seven Minnesota MSAs covered here. Service Providing industries added 112 jobs (0.2 percent), but that growth was undercut by a loss of 56 jobs (0.6 percent) in Goods Producing industries.
Employment in the Fargo-Moorhead MSA was down by 1,193 (0.8 percent) in December. Mining, Logging, and Construction lost 1,284 jobs (12.3 percent). Professional and Business Services was down 254 or 1.5 percent, and Educational and Health Services was down 234, 1 percent. Annually the Fargo-Moorhead MSA added 515 jobs (0.4 percent). Mining, Logging, and Construction added 274 jobs (3.1 percent), and Financial Activities added 304 (2.8 percent) as those supersectors were the top two in the area in both proportional and absolute growth.
Employment in the Grand Forks-East Grand Forks MSA was down by 972 (1.7 percent) in December. Mining, Logging and Construction lost 363 jobs (9.6 percent), Professional and Business Services lost 137 (4.5 percent), and Educational and Health Services lost 147 (1.5 percent). Annually the area added 122 jobs (0.2 percent). Manufacturing had the most notable increase, adding 410 jobs (10.3 percent), while Leisure and Hospitality had the biggest losses (down 516 or 8.2 percent).
