by Mark Schultz and Luke Greiner
September 2020
COVID-19 has thrown the state of Minnesota for an extreme loop, with many companies having to shut their doors temporarily and some having to close altogether. Though less impacted than other parts of the state, businesses in the Southwest region have found themselves having to lay off or even terminate employees. This forced myriad out-of-work people to apply for Unemployment Insurance (UI), with many continuing to request benefits, some with no end point in sight.
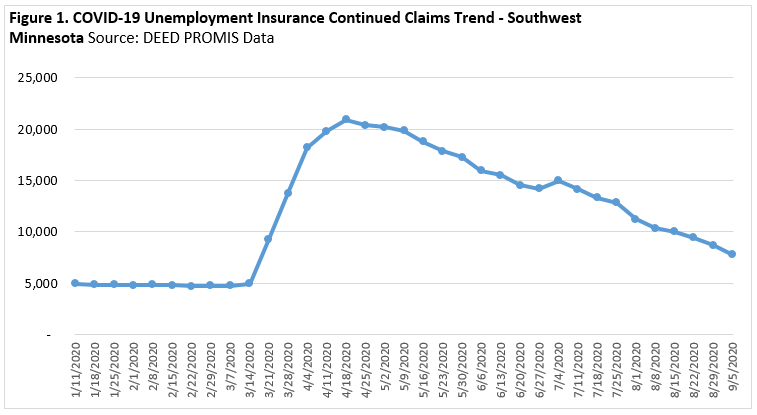
One measure that offers great insight into the number of unemployed individuals in the region is continued claims, which are UI claims that have been made after the initial application for benefits has been completed. Since the onset of COVID-19, the number of continued claims in the South Central and Southwest regions began to increase after the week ending on March 14 and reached its apex the week ending April 18. During this time frame, the number of continued UI claims in the region jumped from 4,977 to 20,900, an increase of 324%. Since the peak however, for the most part the region has seen a steady decline, even dropping back below 8,695 claims in the last week of August. Unfortunately, that is still far from reaching pre-COVID-19 levels (see Figure 1).

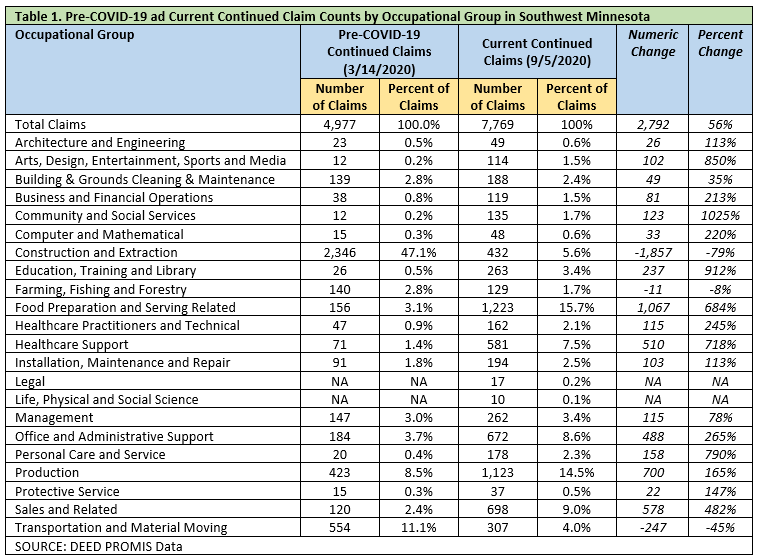
While many workers and nearly all occupational groups felt the sting of COVID-19, some, such as food service and personal care, were hit harder than others. As shown in Table 1, weekly benefit requests prior to COVID-19 were by far highest among Construction and Extraction occupations, which saw a count of 2,346 in the week ending on March 14, which makes sense as many construction workers would still have been off work from Minnesota's seasonal constraints. Other occupational groups which saw higher numbers of pre-COVID-19 continued claims include Transportation and Material Moving (554 claims), Production (423 claims), Office and Administrative Support (184 claims), and Food Preparation and Serving Related occupations (156 claims).

Regional recovery has also shown significant variation with some occupational groups ticking back toward pre-COVID-19 levels more quickly than others. As also shown in Table 1, the current number of claims across all occupational groups is still 56% higher than the pre-COVID-19 counts, with a total of 7,769 continued claims for unemployment in the week ending on September 5.
Not surprisingly, some of the occupational groups that were hit hardest by COVID-19 are also the ones that still have much higher percentages of current continued claims compared to their pre-COVID-19 levels. For example, the current count for Community and Social Services occupations is over 1000% higher; Arts, Design, Entertainment, Sports and Media occupations is still up 850% from March, while Personal Care and Service jumped 790% and Food Preparation and Serving Related increased 684% compared to their respective pre-COVID-19 claim numbers. There are, however, some occupational groups whose current number of continued claims is actually lower than their pre-COVID-19 claim numbers, such as Transportation and Material Moving, which is 45% lower, and Construction and Extraction, which saw a decline of 1,857 continued claims during this time frame, a drop of 79%.
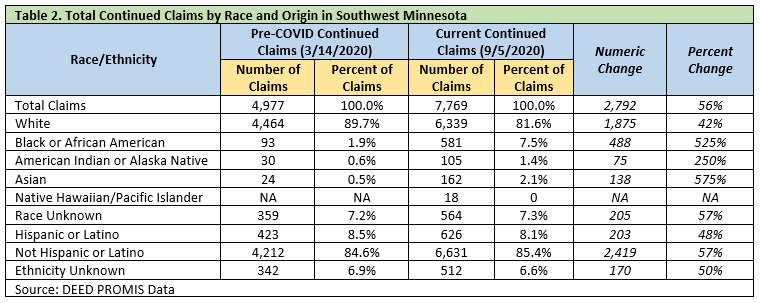
Further analysis of weekly benefits requests reveals that racial disparities exist in recovery after the onset of COVID-19. As shown in Table 2, the number of current continued claims among white workers is 42% higher than the pre-COVID-19 count. In addition, the percentage of total continued claims among whites dropped from 89.7% in March to 81.6% in the current estimate; meaning white workers are more likely to be back at work even as the pandemic stretches on.
Comparatively, the number of continued claims among Black or African American workers remains much higher, sitting at 525% above pre-COVID-19 levels. In addition, the percentage of continued claims among Black or African American workers jumped from 1.9% to 7.5% of total claims in the region, showing disproportionate impact. Unfortunately, Black or African Americans are not the only racial or ethnic group that continue to see higher current claim counts in the region and the state, either. Among Asian workers, the current number of claims are 575% higher while those among American Indian or Alaska Native climbed 250% (see Table 2).

The varying effects of the pandemic and the resulting policies that impacted occupations differently go beyond race and income levels and are also impacted by geography. While South Central and Southwest Minnesota have had lower rates of unemployment and UI claims, certain counties stand out. Normal economic churn and seasonal layoffs create regular unemployment situations that continue for extended durations in a typical year. However, when the weather warms up employment in these seasonal industries typically returns and unemployment falls. Comparing the growth in continued claims from pre-pandemic to post-pandemic times shows the results of the unique circumstances in each county.
Minnesota had 64,920 continued claims the week ending March 7, while South Central and Southwest Minnesota had just 4,749 (7.3% of the state's total). By the week ending with September 5, Minnesota had 181,223 continued claims and South Central and Southwest had 7,769 (4.3% of the total). Furthermore, continued claims grew by 179% in Minnesota in that time, but only increased 64% in South Central and Southwest Minnesota. The unprecedented rise in continued claims over this period is a departure from typical trends, where we usually see unemployment drop with warmer weather and employment expansion.
Across South Central and Southwest Minnesota there are some large differences in UI trends, with Nicollet and Blue Earth County (which make up the Mankato/North Mankato metropolitan statistical area) both seeing larger increases in continued claims since the beginning of March than Minnesota as a whole, while other counties have actually seen a decline in continued claims. It is a positive and optimistic sign for those counties that have seen UI claims fall to lower levels, and certainly an indicator of how geography changes the impacts of the COVID-19 pandemic (see Figure 2).
While the pandemic has impacted the economy in every county of the state, the degree to which it translates into layoffs is a complex culmination of factors including labor force changes and industry mix. In the map of Southwest Minnesota below you can see the large increases in the counties that contain the Mankato MSA; yet Lyon County, home to the region's second largest city of Marshall, has experienced much less economic disruption. The industry mix among counties also shows through the data – with the prominent food manufacturing facilities in the very southwestern corner prompting large increases in continued claims (see Figure 3).
Continued UI claims are an excellent indicator of how workers – and the overall economy – are doing in the region. Without trying to calculate all the externalities that can impact the economy including consumer preferences, supply chains, price sensitivity, and more; data on jobs are always informative. It might be a lagging indicator on an individual level, but job counts and the number of people still receiving UI benefits provide an idea of the direction things are heading. The good news is that South Central and Southwest Minnesota continue to make progress on the road to recovery.