by Dave Senf
November 2014
In an age of significant specialization Temporary Help Agencies were not slow to get on board. There are now agencies that specialize in dental hygienists, substitute teachers, personal care assistants, web designers, event coordinators, financial analysts, and real estate attorneys as well as the more traditional hand laborers and freight movers, assemblers and fabricators, office clerks, and customer service representatives. Temporary help agencies now make up most of the employment services industry group.1
Some of the largest providers of temporary workers in Minnesota also provide workers around the globe. Minnesota's leading staffing agencies each supply in the neighborhood of 1,000 to 5,000 workers to Minnesota companies on any given day, filling a long list of occupational needs across a wide array of industries.2
According to County Business Pattern data, Minnesota had 912 temp staffing agencies in 2012 or roughly 2 percent of the nation's 47,500. That seems about right since Minnesota's share of national employment services industry jobs hovers around 2 percent. Table 1 breaks out companies by their employment size for Minnesota and the nation. Minnesota's breakdown of temp agency by employment size is almost identical to the national distribution. Employment in this industry includes the temp firms' permanent employees plus the temp employees sent out to work at other companies.
| Employment Services Companies by Employment Size | ||||
|---|---|---|---|---|
| Number of establishments by employment-size class | U.S. | Percent of Companies | Minnesota | Percent of Companies |
| Total | 47,468 | - | 912 | - |
| 1-4 | 17,804 | 38 | 333 | 37 |
| 5-9 | 4,464 | 9 | 86 | 9 |
| 10-19 | 4,238 | 9 | 82 | 9 |
| 20-49 | 6,485 | 14 | 124 | 14 |
| 50-99 | 5,722 | 12 | 107 | 12 |
| 100-249 | 5,329 | 11 | 111 | 12 |
| 250-499 | 1,935 | 4 | 36 | 4 |
| 500-999 | 885 | 2 | 20 | 2 |
| 1,000 or more | 606 | 1 | 13 | 1 |
| Source: U.S. Census, 2012 County Business Patterns | ||||
As is common in many industries there are a lot of small companies in the employment services industry, but employment is concentrated at large companies. In Minnesota the largest 10 temp firms are estimated to employ more than 30 percent of the state's temporary workforce. That means 20,000 workers of the 65,300 temp workers employed in September were employed by the top 10 temp agencies.
Minnesota's temp industry is on track to employ approximately 63,000 on an annual basis in 2014, which is up 2.0 percent from 2013. Other sectors or industries with total employment in the 60,000 to 67,000 range are Offices of Physicians, Private Educational Services, Insurance Carriers, Durable Goods Wholesalers, State Government Education (including about 24,000 work-study students), and General Merchandise Stores.
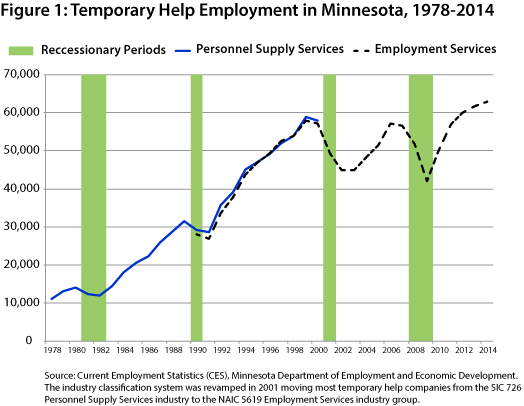
The temp industry has attracted a lot of media attention over the last few years with its hyper pro-cyclical hiring and firing pattern. Minnesota lost 3.9 percent of its total jobs in 2009 while temp jobs plunged 18.6 percent. Temp jobs rebounded 19 percent in 2010 even as total jobs dipped another 0.5 percent. The industry's role as supplier of the state's just-in-time workforce, however, wasn't exclusive to the Great Recession's dismal job market. The temp workforce has always gone up and down with economic expansions and contractions (Figure 1).

The industry swings have, however, intensified during recent recessions. The peak to trough, calculated on an annual average basis, was 14.7 and 11.5 percent during the early 1980s and 1990s recessions. Recession-induced plunges rose to 23.8 and 28.1 percent during the two more recent downturns. Companies have become more reliant on using temp workers to manage their workforces. That reliance swings both ways, however, as sharp falls in temp jobs are followed by rapid upticks when business improves. Minnesota temp jobs rebounded quickly in 2010 and 2011 with employment climbing 19.0 and 13.8 percent in 2010 and 2011.
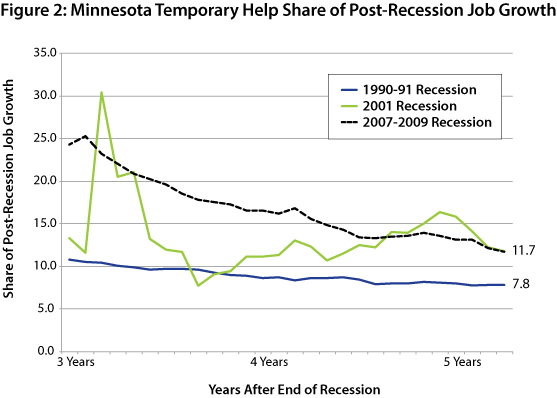
The spike in temp hiring after the Great Recession combined with slow job growth in most other sectors translated into temp employment's accounting for a large share of job growth, especially during the first few years of the job recovery. This development, however, just like the temp workforce spike during the first few years of recovery, isn't an entirely new phenomenon. As with the rapid rise in temp employment, the recent temp help story is one of degree rather than any sort of historical switch.
Job growth in Minnesota accounted for by temp job growth stands at 11.7 percent five years after the Great Recession officially ended in June 2009. That is the same percent of job growth five years after the 2001 recession. Five years after the 1990-91 recession the percentage was 7.8 percent (Figure 2). Temp job growth accounted for a much higher share of the job rebound immediately after the Great Recession compared to earlier recessions, but the difference has narrowed over the last few years as temp job growth tailed off and overall job growth held steady in the 1.6-1.8 percent range since 2011.

The temp industry's share of post-recession job growth in Minnesota was similar to the temp industry's share at the national level until last year when Minnesota's share dropped below the national share. As of last month, the national share of job growth accounted for by temp jobs was 14.9 percent; the share in Minnesota was 11.7 percent.
Temp agency employment in 2014 will for the third straight year represent approximately 2.2 percent of the all wage and salary employment in Minnesota. The 2.2 percent share is the all-time high that was also reached in 1999 during the booming 1990s economy. So once again the strong temp employee growth during the Great Recession isn't breaking new ground.
The 2.2 percent share of all wage and salary employment accounted for by Minnesota's temp workers is slightly less than the national 2.4 percent. Michigan leads the nation with 3.8 percent, primarily from the use of temp workers in the auto industry. Smaller states, more dependent on agriculture and less dependent on manufacturing, have less than 1 percent of their wage and salary workers provided by temp agencies (Table 2).
| 2013 Employment Services Jobs as a Percent of Total Wage and Salary Employment | ||
|---|---|---|
| Rank | State | Percent |
| 1 | MI | 3.9 |
| 2 | AZ | 3.8 |
| 3 | IL | 3.6 |
| 4 | GA | 3.5 |
| 5 | TN | 3.4 |
| U.S. | 2.4 | |
| 16 | TX | 2.5 |
| 17 | WI | 2.4 |
| 18 | MN | 2.2 |
| 19 | FL | 2.2 |
| 20 | MS | 2.2 |
| 45 | MT | 1.0 |
| 46 | ND | 0.9 |
| 47 | VT | 0.8 |
| 48 | SD | 0.7 |
| 49 | WY | 0.6 |
| 50 | AK | 0.4 |
| Source: U.S. Bureau of Labor Statistics, Quarterly Census of Employment and Wages (QCEW | ||
Although all sorts of occupations are filled by temp workers with temp workers employed across 270 occupations in Minnesota in 2012, temp jobs are still heavily skewed to certain fields. According to Occupational Employment Statistics (OES) data complied by this agency, the top 10 temp occupations filled by Minnesota temp workers accounted for 55 percent of all temp employment in 2012 while the top 50 occupations added up to 87 percent of all temp jobs. Temp employment nationally is slightly less concentrated with 43 and 77 percent of the temps employed in the top 10 and top 50 occupations. Table 3 lists the top 10 occupations in Minnesota as well as nationally.
| Top 10 Temp Help Occupations | ||
|---|---|---|
| Occupation | 2012 Employment | Percent of Occupation Held by Temp Workers |
| Minnesota | ||
| Production Work Helpers | 5,946 | 52 |
| Hand Laborers and Material Movers | 5,578 | 17 |
| Assemblers and Fabricators | 5,029 | 31 |
| Team Assemblers | 3,675 | 21 |
| General Office Clerk | 2,971 | 5 |
| Hand Packers and Packagers | 2,495 | 22 |
| Customer Service Representatives | 2,140 | 4 |
| Personal Care Aides | 2,056 | 4 |
| All Other Production Workers | 2,038 | 25 |
| Human Resources Specialists | 1,485 | 14 |
| U.S. | ||
| Hand Laborers and Material Movers | 398,900 | 18 |
| Team Assemblers | 178,900 | 17 |
| General Office Clerks | 167,100 | 6 |
| Production Work Helpers | 123,900 | 30 |
| Hand Packers and Packagers | 108,200 | 16 |
| Customer service representatives | 96,200 | 4 |
| Assemblers and Fabricators | 78,400 | 28 |
| Construction laborers | 77,700 | 7 |
| Secretaries and Administrative Assistants | 73,500 | 3 |
| Human Resources Specialists | 64,600 | 15 |
| Source: U.S. Bureau of Labor Statistics and Minnesota Department of Employment and Economic Development.
Data are from the industry staffing patterns used in long-term projections. |
||
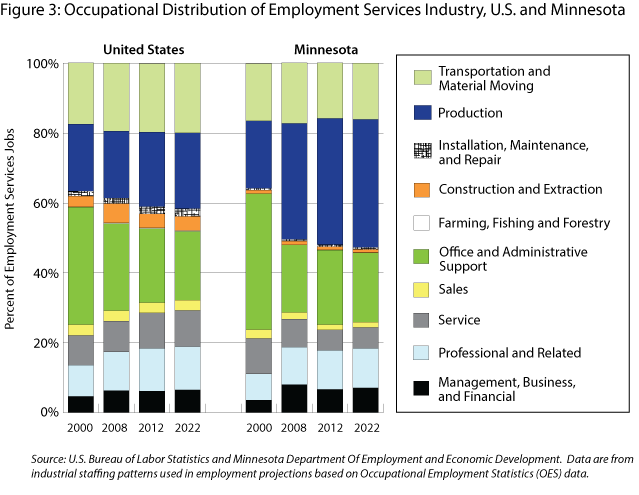
Minnesota's temp workforce has shifted over the last two decades from predominately office and administrative support work to production work in the state's manufacturing sector. Minnesota's manufacturers have increasingly turned to just-in-time labor to go with just-in-time inventory and just-in-time production to remain globally competitive. Production temp jobs now exceed office and administrative support temp jobs in Minnesota while nationally the two groups account for roughly the same percent of temp work (Figure 3).

A decade ago almost 40 percent of Minnesota's temp workforce was employed in office jobs like bookkeeping, customer service reps, stock clerks, or data entry keyers. Now just over 20 percent of temps are employed in office settings. Ten years ago fewer than 20 percent of the state's temp workers were involved in production occupations. Today 36 percent of the temp workforce is in production occupations such as production work helpers, assemblers and fabricators, team assemblers, hand packers and packagers, and all other production workers. Minnesota manufacturers employed 70 percent of the state's 223,000 production workers in 2012. If manufacturers employ the same percentage of the 22,000 temp workers who work in production occupations, then the manufacturing sector employs approximately 15,000 temp workers in production jobs. Those workers represent 5 percent of all manufacturing employment and 10 percent of all manufacturing production employment.
The manufacturing sector's reliance on temp staffing is expected to continue to increase in the future. Even though manufacturing employment is expected to drop by 4,000 by 2022, production jobs at temp agencies are expected to jump by 3,700 jobs. Most of the increased demand for temp production workers will come from manufacturers. The increased use of temp workers in manufacturing may be a contributing factor to the widely talked about skills gap the sector is facing. Training and up-skilling must be hard to accomplish if 10 percent of the sector's production workers are temp workers who continuously turn over.
A smaller shift to more managerial and professional temp workers has also occurred over the last decade. Professional and related jobs were 7.5 percent of temp workers in Minnesota a decade ago and are now 11.3 percent. Temp management, business, and financial jobs have climbed to 6.7 percent of temp employment from 3.7 percent in 2000. That means more temp jobs for occupations like computer system analysts, accountants, auditors, engineers, computer programmers, and general managers.
As shown in Figure 3 the occupational shifting among temp workers is expected to continue over the next decade with production jobs and professional and management, business, and financial jobs increasing while office and administrative jobs decrease slightly. The percent of employment that will be temp employment will be higher in 10 years but that isn't new news. Temp workers' share of wage and salary employment has grown from 0.7 percent of the 1.6 million wage and salary workers in 1978 or 11,100 temp workers to 2.2 percent of the 2.8 million wage and salary workers or 62,900 workers in 2014. Temp employment in the state has expanded seven times as fast as overall employment since 1978. Minnesota's temp jobs will continue to outpace total job growth and have years like the last few when growth spikes but, following long-term trends, temp workers are likely to make up somewhere around 2.5 percent of Minnesota's workforce in 2022.
1The Employment Services industry group (NAICS 5631) is made up of three industries: Employment Placement Agencies, Temporary Help Services, and Professional Employer Organizations. Temporary Help Services accounted for 93 and 80 percent of Employment Services employment in 2013 in Minnesota and the U.S. respectively.
2Estimates of temp agencies' daily workforces and market concentration are based on the Minneapolis-St. Paul Business Journal's Top 25 List of Temporary Employment Firms for 2012.