by Dave Senf
October 2016
Note: All data except for Minnesota’s PMI have been seasonally adjusted. See the feature article in the Minnesota Employment Review, May 2010, for more information on the Minnesota Index.
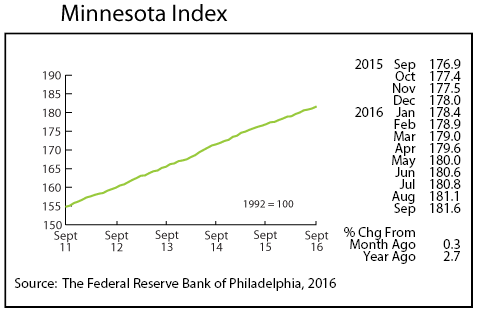
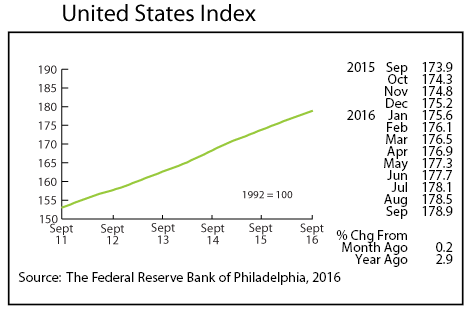
The Minnesota Index, after inching along with 0.1 percent increases during the previous two months, accelerated in September, advancing 0.3 percent. Increasing wage and salary employment along with an uptick in average weekly manufacturing hours drove the index up. The state’s unemployment rate was 4.0 percent for the second straight month. The U.S. Index climbed 0.2 percent for the 10th month in a row in September.
Minnesota’s index increased 2.7 percent from a year ago while the U.S. index was up 2.9 percent since last September. Minnesota’s index, which is a proxy for the state’s GDP, has been lagging slightly behind the U.S. index for about two years. Minnesota’s index in September was up 5.9 percent from September 2014 compared to the U.S. index’s gain of 6.3 percent.
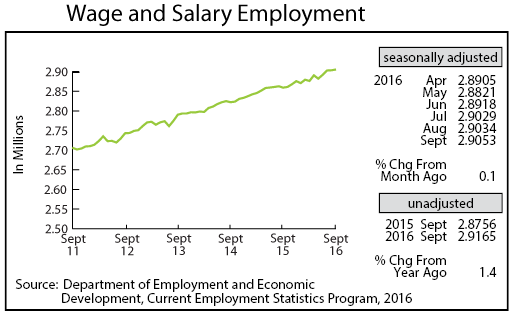
Minnesota’s adjusted Wage and Salary Employment increased for the fourth consecutive month in September after August’s job loss was revised to show a 500 increase. That is the longest stretch of monthly job growth since the 11-month string of job growth from October 2014 to August 2015. Jobs jumped by 1,900 in September with 300 private sector jobs added while public jobs increased by 1,600. The largest one-month increase ever recorded for Professional and Business Services (10,500) offset job losses in Educational and Health Services (3,800), Leisure and Hospitality (3,700), and Trade, Transportation, and Utilities (2,900). Manufacturing added 700 jobs, but for the year jobs in this sector are down by 300.
Minnesota’s year-over-year job growth rate dipped from 1.5 percent in August to 1.4 percent in September. Over-the-year job growth for the U.S. was 1.7 percent for the fourth straight month. Minnesota’s annual average growth through September stands at 1.3 which, if it holds, will be the slowest annual gain in jobs since Minnesota’s job rebound from the Great Recession started in 2011.
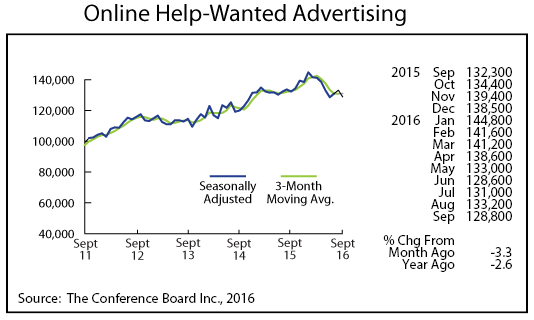
Online Help-Wanted Ads slipped in September to 128,800, their lowest level since November 2014. U.S. online job ads also fell in September, dipping 1.9 percent compared to Minnesota’s 3.3 percent drop. U.S. online job ads also peaked in November 2014. Online job ads in Minnesota have dropped 11.1 percent since November 2014 while declining 14.9 percent nationally. The higher cost of displaying ads on some job boards may be behind most of the decline in online help-wanted ads, but the downward trend is worth watching.
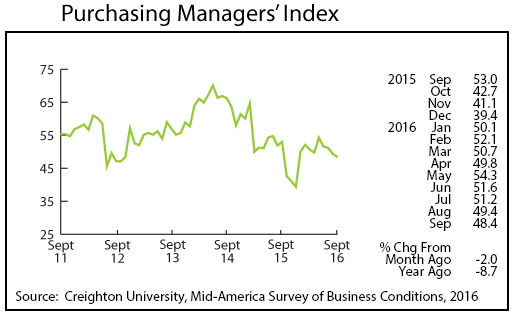
Minnesota’s Purchasing Managers’ Index (PMI) dipped for the fourth straight month in September, tailing off to 48.4, the lowest reading since December 2015. The last time the PMI index fell for four months in a row was July 2010. September’s reading suggests that the state’s manufacturers are stuck in neutral. The Mid-American Business Conditions Index, a leading economic indicator for nine-states, including Minnesota, fell to 45.5. The corresponding national index, the PMI (Purchasing Managers’ Index) produced by the Institute for Supply Management ticked up to 51.5.
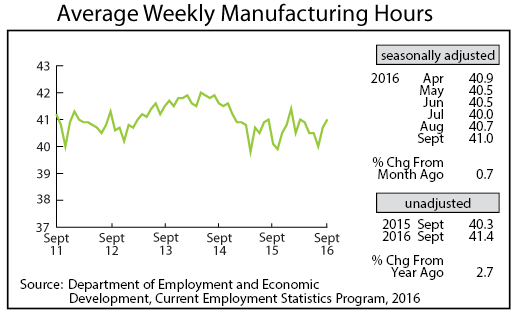
Adjusted Manufacturing Hours rose for the second straight month in September, reaching 41.0 hours for the first time since March. The recent jump in average factory hours may be the first sign that manufacturing is beginning to pick up.
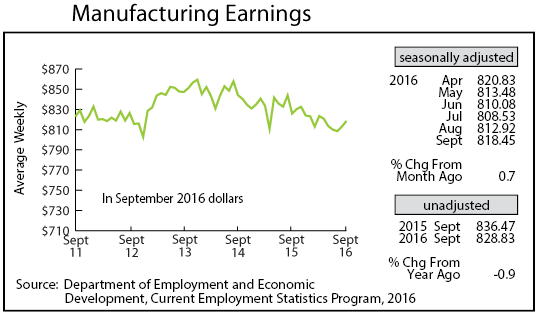
Average weekly Manufacturing Earnings also climbed for the second month in a row in September, jumping to $818.45. Average weekly manufacturing earnings, adjusted for inflation and seasonality, however, continue to be below last year’s levels. This has been the case for two and a half years.
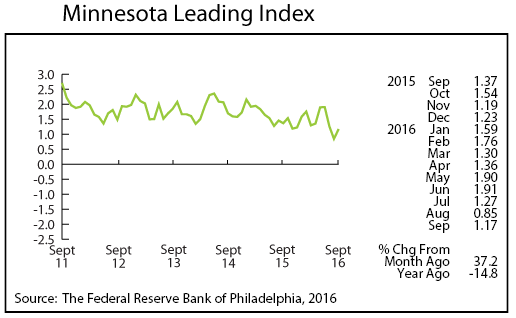
The Minnesota Leading Index rebounded a bit in September after steep declines during the previous two months. The 1.17 reading translates into the Minnesota economy’s growing by 1.17 percent over the next six months. That is low compared to readings earlier in the year but better than the U.S. index which came in at 1.15 in September.
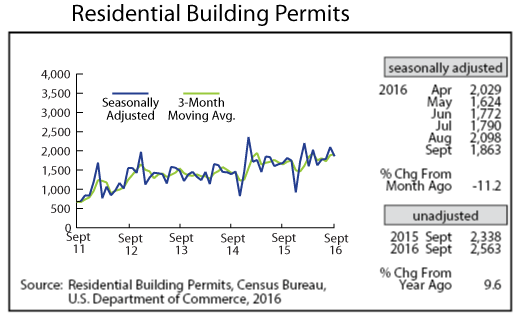
Adjusted Residential Building Permits fell in September to 1,863. Despite the home-building permit drop, 2016 permits through September are up 10.1 percent compared to a year ago. Minnesota home-building activity this year is on its way to beating 2015 activity, but improvement is moderate at best.
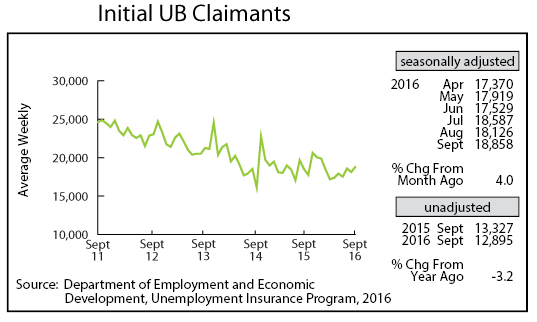
Adjusted Initial Claims for Unemployment Benefits (UB) zigzagged up in September to 18,858, the highest level since January. Initial claims, a proxy for the layoff rate, have been drifting upward since March but remain low by historical standards. The uptick, however, is worth watching as an increase in initial claims is an early indicator of slowing job growth.