by Mohamed Mourssi
June 2014
This report provides an analysis of demographic and economic statistics on the employment of the non-institutionalized population with disabilities in Minnesota over the period 2008-2012. Data in this article are based on American Community Survey (ACS), and the targeted population comprises working-age men and women, aged 21-64, who self-report a work-limitation-based disability as defined by ACS.
Race groups will be classified into five categories: White, Black/African American, Native American or Alaska Native, Asian, and Other Races. The Other Races category includes Asian Indians, Native Hawaiian, Guamanian or Chamorro, etc. In general, evidence from ACS data suggests that people with disabilities are disadvantaged in the labor market in Minnesota and nationally and that there are significant disparities in disability employment rates between white groups and people of color.
Table 1 shows the prevalence of disability within various racial groups in Minnesota compared to the nation. On average, 10.4 percent of the entire non-institutionalized population in the U.S. between the ages of 21 and 64 reported having a long-standing health problem or disability from 2008 to 2012. Compare that to the overall rate for disability prevalence in Minnesota of 8.2 percent for the same population. The disability prevalence rate in the white group drops to 7.7 percent in Minnesota and 10.2 percent at the national level, but is significantly higher among all non-white groups except for Asians. At 20.2 percent the Native American or Alaska Native group reported the highest rate of disability prevalence. The average rate in the U.S. is about 18 percent.
| Table 1: Disability Prevalence in Population Aged 21-64 by Race from 2008-2012 | |||||||
|---|---|---|---|---|---|---|---|
| 2008 | 2009 | 2010 | 2011 | 2012 | Average | ||
| All Races | U.S. | 10.4% | 10.4% | 10.3% | 10.5% | 10.4% | 10.4% |
| MN | 7.9% | 8.4% | 8.3% | 7.9% | 8.5% | 8.2% | |
| White | U.S. | 10.2% | 10.1% | 10.2% | 10.3% | 10.2% | 10.2% |
| MN | 7.5% | 7.7% | 7.9% | 7.5% | 8.1% | 7.7% | |
| Black/African American | U.S. | 14.3% | 14.1% | 13.8% | 14.2% | 14.2% | 14.1% |
| MN | 15.6% | 16.6% | 14.1% | 12.9% | 16.0% | 15.0% | |
| Native American or Alaska Native | U.S. | 18.8% | 18.0% | 17.3% | 18.0% | 17.6% | 17.9% |
| MN | 15.7% | 25.4% | 22.5% | 21.1% | 16.3% | 20.2% | |
| Asian | U.S. | 4.6% | 4.5% | 4.1% | 4.1% | 4.3% | 4.3% |
| MN | 4.9% | 7.3% | 5.0% | 4.4% | 6.4% | 5.6% | |
| Others | U.S. | 9.8% | 10.1% | 9.3% | 9.5% | 9.9% | 9.7% |
| MN | 8.4% | 13.1% | 10.8% | 9.5% | 8.4% | 10.0% | |
| Source: 2008-2012 American Community Survey | |||||||
The second-highest rate of disability prevalence exists among Black/African Americans, with an average in Minnesota of 15.0 percent and in the U.S. of 14.1 percent. Asians showed the lowest disability prevalence rate at 5.6 percent in Minnesota and 4.3 percent nationally. Other Races reported a disability prevalence rate similar to that of the entire population - 10.0 percent in Minnesota and 9.7 in the U.S. These reported rates of disability prevalence among non-white groups trigger questions about the causes of disability and strategies for disability prevention and health care for all demographic groups.

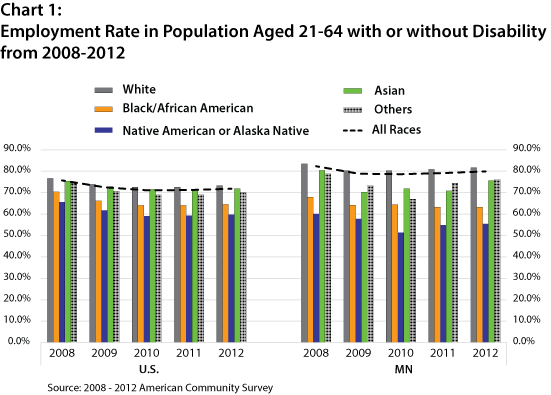
Chart 1 shows the employment rate among all race groups in Minnesota with comparison to the U.S. rates for the population with or without disability. The economy started to recover from the recession in 2011 and continued to improve in 2012. Since 2005, however, the white group recorded a higher employment rate than the overall rate for all races every year, and, accordingly, higher than any of the non-white race groups. The Native American or Alaska Native group reported the lowest employment rate, followed by the Black/African American group in both the U.S. and Minnesota in all years for the population with or without disabilities and for the population without disabilities. However, the case for Native Americans or Alaska Natives changed slightly among of people with disabilities (Chart 3). The Asian group had the highest employment rates among all minority groups in most cases.

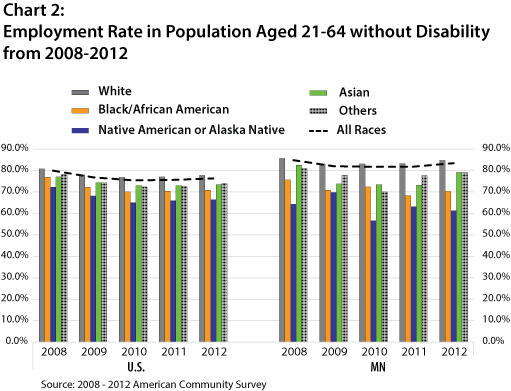
Chart 2 illustrates the employment rate among all race groups in the population without disabilities. In this population the employment rate for all races in Minnesota was 84.8 percent in 2008. It declined during the recession years until 2010 before it started to stabilize in 2011 (82.0, 81.7, and 81.8 percent respectively) increasing to 83.4 percent in 2012. These rates were higher than that of the U.S. in all years. Notably, employment rates had not come back to the pre-recession levels for all groups by 2012.
Similar to the distribution in Chart 1, whites reported the highest employment rate in all years, exceeding the rate for all races. Likewise, whites with no disabilities in Minnesota exhibited significantly higher employment rates in all five years than those of the U.S.
The employment rate for Native American or Alaska Native Minnesotans not only remained the lowest among all groups in all years, but it also showed significantly lower rates than the U.S. levels in all years. In 2008 the employment rate for Native Americans or Alaska Natives in Minnesota was 64.3 percent. It increased to 69.8 percent in 2009, declined to 56.6 percent in 2010, increased to 63.2 percent in 2011, in line with the recovery from the recession reported in all groups, and decreased again in 2012 to 61.3 percent. This was the only decrease in employment for race groups without disabilities between 2011 and 2012. The U.S. employment rates for Native American or Alaska Native group were also the lowest among all race groups in all years.
Black/African Americans showed the second-lowest employment rate in all years, following the rates of the Native Americans or Alaska Natives. Although most groups showed some improvement in 2011, the employment rate for Black/African American Minnesotans decreased from 72.4 in 2010 to 68.3 percent in 2011, before increasing to 70.2 percent in 2012. Minnesota showed a lower employment rate for Black/African Americans than the national rate in four of the five years.
As shown in Charts 1 and 2, the Asians and Other Races cohorts maintained more stable employment and followed the employment rates for whites in all years. Employment rates in these two groups were much better than those for Black/African Americans and Native Americans or Alaska Natives in Minnesota and nationally. In addition, the employment rates for Asians and Other Races were higher than employment rates for the same groups in the U.S. in most years.

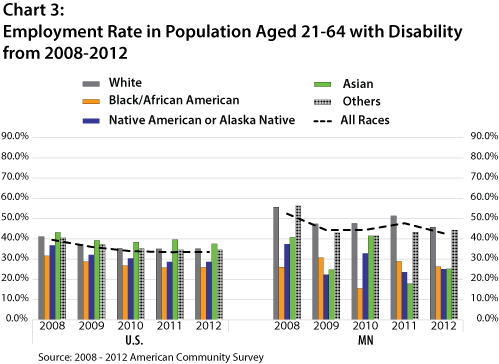
As shown in Chart 3, the employment rate for disabled people of all races in Minnesota was 52.4 percent in 2008. Because of the recession it decreased to 44.3 percent in 2009 and 44.4 percent in 2010. It increased to 47.7 percent in 2011 before it dropped to 42.7 percent in 2012. These Minnesota rates were higher than those for the U.S. in all years, which showed similar trends reflecting the same instability compared to the population with no disabilities.
As seen in Charts 1 and 2, whites reported significantly higher employment rates in all years than all races and exceeded the rate for all race groups in all years except 2008, when Other Races reported a higher employment rate than whites by 0.6 percent. In comparison, whites with disabilities in Minnesota had significantly higher employment rates than those of the U.S in all five years.
The employment rates for Native Americans or Alaska Natives and Black/African Americans with disabilities in Minnesota not only remained the lowest among all groups in all years, but they also showed significantly lower rates than the U.S. levels in most years. In 2008 the employment rate for Native Americans or Alaska Natives with disabilities in Minnesota was 37.4 percent. It decreased to 22.3 percent in 2009 before increasing to 32.8 percent in 2010, decreased to 23.6 percent in 2011, then increasing to 25.0 in 2012. The U.S. employment rate for the Native Americans or Alaska Natives with disabilities was also the lowest among all races. Interestingly, while figures for most groups and for people without disabilities showed some post-recession improvement in 2011 and 2012, the employment rate for Native American or Alaska Native with disabilities declined in 2011 to 28.6 percent and remained the same in 2012.
Black/African Americans in Minnesota showed the second-lowest employment rate overall during the 2008-2012 period, alternating with Native American or Alaska Natives in successive years. The employment rate for the Black/African Americans was 26 percent in 2008 and 30.7 percent in 2009, decreasing sharply to 15.5 percent in 2010, before rebounding to 28.8 percent in 2011, and declining to 26.3 percent in 2012. The U.S. rates were higher than Minnesota's in two of the five years and showed almost the same rate in one year.
Although the Asians have shown a more stable and higher employment rate in Charts 1 and 2, Asian Minnesotans with disabilities experienced some instability in the labor market during the years 2008-2012. In 2008 Asian Minnesotans with disabilities reported an employment rate of 40.7 percent, about 15.0 percentage points lower than the rate for all races and for that of whites. This rate was also below the U.S. employment rate for the same group (43.2 percent). The employment rate dropped dramatically in 2009 to 24.8 percent, about half of the rates for all races and for whites, and was about 15 percentage points lower than the national rate. It reduced the gap with the rates of all races and whites in 2010, increasing to 41.5 percent, and for the first time exceeding the national rate by 3.2 percent. Another dramatic decline in the employment rate for Asians with disabilities occurred in 2011, when it was 17.9 percent. The decline occurred in a year in which most sectors and groups started to show recovery from the recession.
Other Races with disabilities in Minnesota maintained more stable employment, following whites in their employment rates in all years. Employment rates in these two groups also were much better than those for Black/African Americans, Native Americans or Alaska Natives, and Asians in Minnesota and nationally. In addition, the employment rates for Other Races with disabilities were higher than employment rates for the same group in the U.S. in all years.
Data in this report show that large variations in employment between people with disabilities and those with no disabilities exist despite recent positive economic development. While Minnesota maintains the second-highest rate of disability employment compared with other states, the employment rates of non-whites with disabilities participating in the workforce is still significantly lower than in many other states, notably for the two groups, Black/African American and Native Americans/Alaska Natives. In addition, the ACS data indicate that recovery from the two-year recession was slower for non-whites with disabilities in the U.S. and Minnesota. It is also worth noting that the significant decrease of the employment rates among all groups from 2008 to 2009 was driven by two factors: 1) the impact of the recession and 2) narrowing the definition of disability by the ACS, which took place in 2008. The findings highlight the impact of the "double whammy" of disability and minority-group status on employment rates of racial minorities in Minnesota and in the U.S.
The Civil Rights Act of 1964 and the Americans with Disabilities Act (ADA) of 1990 have achieved a great deal in setting rules and promoting employment for racial minorities, women, and people with disabilities. However, changes to Section 503 of the Rehabilitation Act announced by the U.S. Department of Labor, which took effect in March 2014, are said to have the potential for much greater impact and scale than the ADA in terms of employment for people with disabilities. Changes to the 503 rule include setting a goal for contractors doing business with the federal government to reserve 7 percent of their workforce for people with disabilities. Such a goal is projected to narrow the persistent employment gap for people with disabilities compared to people without disabilities. For Minnesota it is imperative that policy makers consider implementing a similar rule in addition to the establishment of non-competitive hiring authority to grant priority for qualified job seekers with disabilities. It is also essential that employers restructure their workforces by hiring more people with disabilities from all race groups, which will enable them to gain the advantages of resiliency and creativity brought in by a more diverse workforce.