by Amanda Rohrer
March 2017
With the tulips peeking out and spring break come and gone, thoughts of summer aren’t far behind. Teens and young adults may be deciding how to spend their free months and looking for summer jobs. They may wonder which industries to look in and whether they’ll earn enough to make it worth their while. Will jobs be scarce? Will they lose out to more experienced workers? Every year we attempt to estimate how labor market conditions will affect their chances. This year we have a new data source that may be particularly useful.
QED: Promise and CaveatsIn 2015 the Minnesota State Legislature approved a bill allowing limited sharing of Drivers’ License data with the Department of Employment and Economic Development (DEED). This allows us to connect the wages reported to each individual at each job to the basic demographic data (date of birth, gender) collected for their licenses and state IDs. The matched wage record and driver’s license data are known as Quarterly Employment Demographics (QED). We previously could get no detailed demographic information about individuals from UI tax records and had to rely on the American Community Survey (ACS) for that sort of analysis. While the ACS is robust, industry, occupation, and income are self-reported and subject to errors of memory or definition. For very granular analysis ACS data uses a 5-year roll-up released at a lag of a year, meaning data are dated and can’t capture seasonal trends. QED solves many of these problems; it’s much more current, it’s reported quarterly so seasonal trends can be observed, and data from UI and licenses are verified and less dependent on survey respondents. That said, it’s not without limitations. Limitations
|
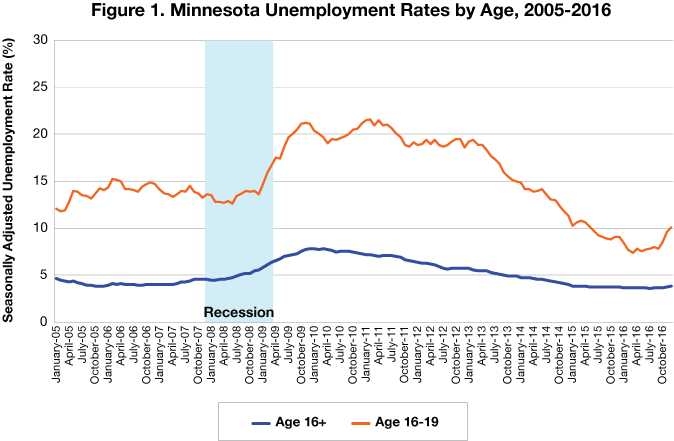
Predicting employment is a tricky business. Seasonal variations and market events can change the trajectory of even the firmest trend. In the years following the recession unemployment rates for young workers spiked. Not only were jobs harder to come by for all demographics, but many older, more experienced workers were forced into entry-level positions which previously may have gone to teenagers. However, that situation has since turned around. As “Minnesota Unemployment Rates by Age” below illustrates, in recent years the labor market in Minnesota has recovered to the point that unemployment is no longer the serious issue it once was with rates for 16 to 19 year olds falling below 10 percent last year. By the end of 2015 the unemployment rate for this age group reached its lowest point since the summer of 2002, well before the recession hit in 2007. This trend coincides with a wider labor force tightening in the state. Unemployment for all workers in Minnesota reached 3 percent in late 2015.
Toward the end of 2016 unemployment rates increased for teens once again. Following an extended period of labor market improvements including a continued low overall unemployment rate, this more likely reflects optimism by teens and their parents that jobs are available and indicates a higher rate of job seeking rather than greater difficulty getting a job.
While unemployment rates are important for understanding a labor market, looking at labor force participation for that particular market as well provides a much more complete picture as the two can exert influence on each other. For example, if having a job became less desirable for teens and large numbers of them decided they didn’t want to work, more jobs would be available than there would be teens to fill them, and it’s likely that unemployment rates would drop. But that would be less indicative of a high demand for teenaged employees and more indicative of a shifting supply and demand relationship.
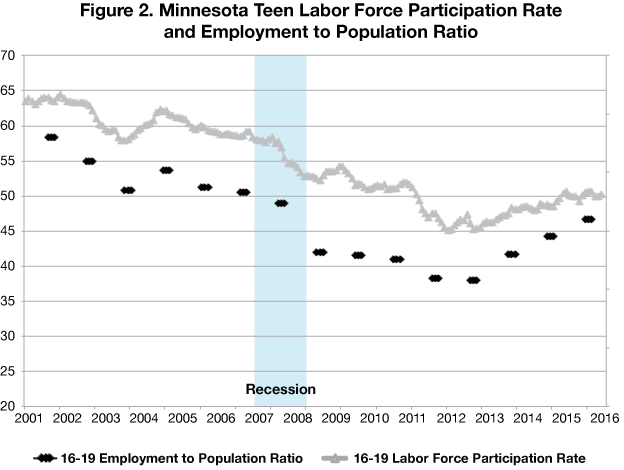
Nationally labor force participation among teens plateaued and began a slow if steady decline in the 1970s. This decline became even more precipitous over the past decade plus. In Minnesota the labor force participation rate for 16 to 19 year-olds plummeted from 63.5 percent at the end of 2001 to 45.1 percent at the end of 2012. That trend is mirrored at the national level with more and more young people choosing to enter the workforce later in life as they pursued higher education in greater numbers. However, the past couple of years have brought a marked departure from the trend of declining participation among young people. As Figure 2 illustrates, Minnesota youths’ participation in the labor market has been steadily increasing since 2013, a rather dramatic change from the long-term trend of declining participation, but still has not achieved pre-recession rates.
Along with solid gains in labor force participation rates, employment to population ratios are also increasing. For teens who often have parental support employment may be more optional than for other groups – they may not even look for work if they perceive their chances of finding employment to be low. Labor force participation is therefore more highly correlated to teen optimism than real employment prospects than it may be for other groups. Employment to population ratio may better reflect teen employment prospects. The abrupt increase in EPR indicates that many more teens are finding jobs than in recent years.
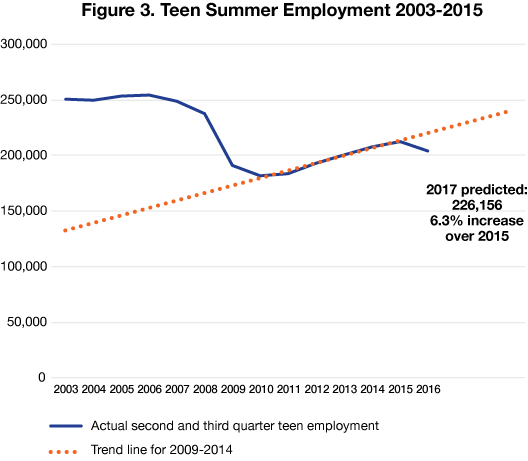
The improving unemployment rates and labor force participation rates and the market conditions that cause them are reflected in the number of employed teens according to QED. The total number of jobs held by teens 19 and under plummeted from 249,225 in the summer of 2007 to 181,353 in the summer of 2010. Since 2010 there has been a steady increase in the number of employed teens, although employment remains well below pre-recession levels. By calculating the post-recession trend line (denoted by the dotted line) and applying it to future years, we get a 2017 summer teen employment of 226,156 – a 6.3 percent increase over 2015 employment levels but still below peak employment. One thing to note is that this data source counts jobs, not people. Teens may be more apt to jump from job to job in a short time period, and therefore may be more likely to be counted at multiple employers than other demographics. If a teen is employed at several different companies for the summer, even if they’re not concurrent, each of those employee-employer relationships will be counted as a separate job.
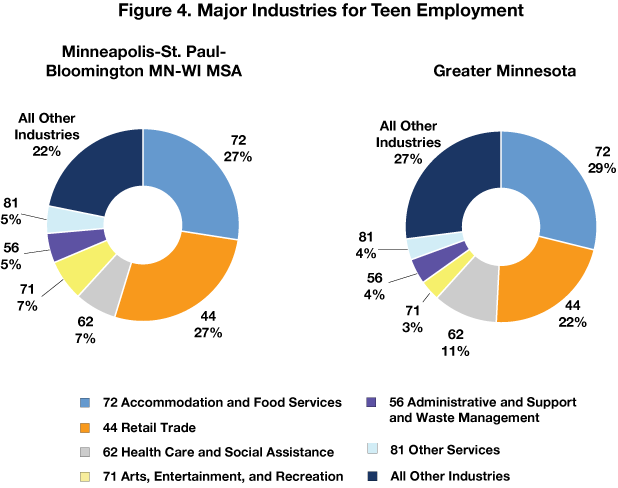
According to wage records, at least half of all teen-held jobs were in Accommodation and Food Service (industry 72) and Retail Trade (industry 44). The proportion in those two industries is slightly higher in the Twin Cities metro than in Greater Minnesota. In Greater Minnesota Health Care and Social Assistance and all other industries also make up a disproportionate share of employment relative to the metro, but for all teens about a quarter of employment opportunities fall within Health Care and Social Assistance, Arts, Entertainment, and Recreation, Administrative and Support and Waste Management Services, and Other Services combined. All other industries make up 22 percent of metro teen jobs and 27 percent of Greater Minnesota teen jobs. Many teens may look first to retail and restaurant jobs because they’re fun – full of young people and with hours that appeal to teens – but other industries may also be hiring for the summer even if they’re less visible.
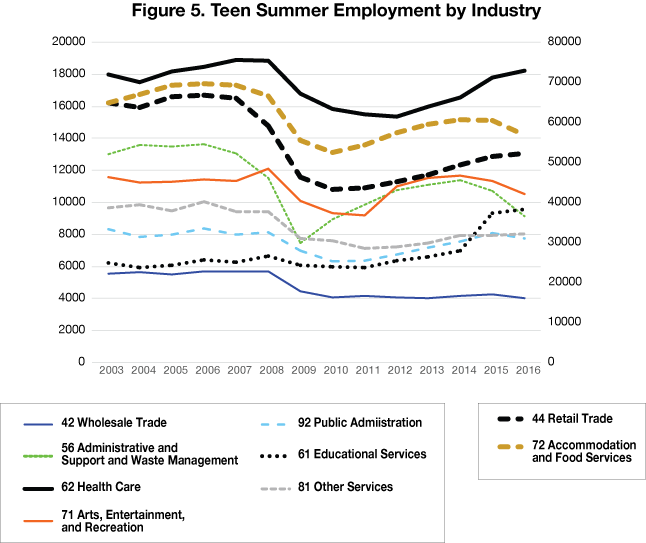
Those other industries are sometimes less subject to the economic trends. In the Teen Summer Employment by Industry chart below the two largest industries by teen employment are denoted by wide dashed lines and are on the right axis. Some industries – Arts, Entertainment, and Recreation (71) and Administrative and Support and Waste Management Services (56) – recovered very quickly post-recession but are dropping off a bit. Public Administration (92) never really declined during the recession and Wholesale Trade (42), Educational Services (61), and Other Services (81) have remained a bit more stable. Health Care (62) is the only industry to be back nearly to its pre-recession peak. Teens looking for short term employment may not care much about the long term trends in the industry of their choice. Teens seem to work in Retail and Food Service by choice – when those industries weren’t hiring, they sought out jobs in industries that were not as hard hit by the recession, and now that those industries are returning teens are going back to them.
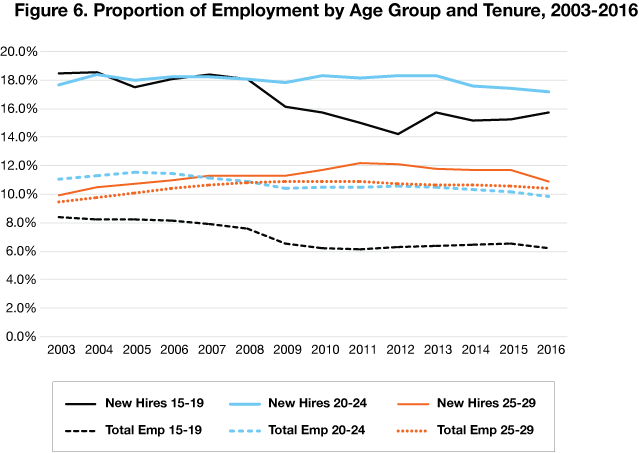
Teens hold between 6 and 8 percent of jobs in the state during the summer months. Of the people newly hired in the summer, though, teens were 15.7 percent for second quarter 2016.
Teens were strongly affected by the recession. Overall share of employment went down at a time when employment was falling, suggesting teens had a harder time during the recession than adult workers. This trend is even more apparent for new hires. Pre-recession, teens made up 18.5 percent of hiring in the summer but that bottomed out at 14.2 percent in 2012. Some recovery is occurring but nowhere near pre-recession levels.
The economy remains stable and more experienced workers can get less seasonal work. Teens are competitive for these positions, and their share of the total has been going up since the post-recession drop-off.
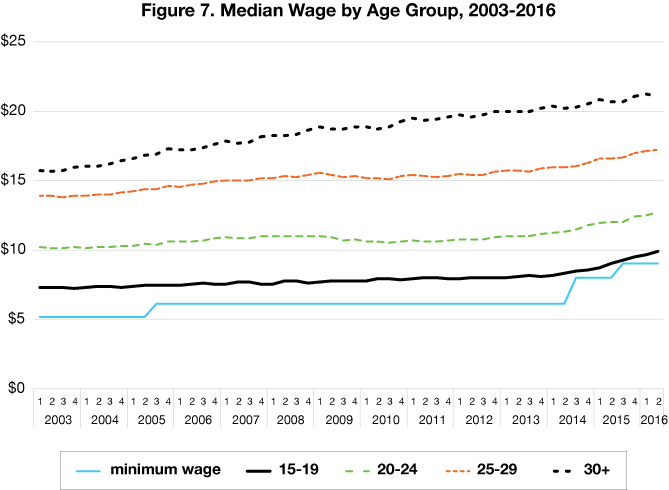
Teen wages are the most likely to be impacted by the minimum wage. After a decade of consistent teen wages in the range of $7.00-8.00 per hour, the recent minimum wage hikes have had a dramatic effect on teen wages – more so than most other age groups. Median wage for teens has stayed just ahead of minimum wage rates the last few years, and with another increase scheduled for this summer, wages are likely to follow that and have a median of around $9.50 per hour in the summer of 2017.
Summer jobs offer young Minnesotans a chance to learn the basic job skills that employers will look for as the teens move forward in their careers. For young people who aren’t pursuing additional education, they represent their first full-time job and the vital income and experience that come with it. These early jobs help teens develop connections with employers, bolster their resumes for future job and college applications, and begin to understand the working world, setting the foundation for adult life as productive citizens of Minnesota.
There are a number of organizations in the state that strive to help young Minnesotans find suitable jobs. Many have a specific focus, such as sales, environmental stewardship, or carpentry. In addition to the programs listed below, DEED provides avenues of assistance for people who come from low income families or have other barriers to employment. The MN Youth Program, Youthbuild Program, and Workforce Investment Act Youth Programs all provide services to young job seekers. You can find more information on these programs, including searchable lists of service providers, at: mn.gov/deed/job-seekers/find-a-job/targeted-services/youth-employment.
This is a partial list of Minnesota youth employment programs and services. Many available opportunities are not listed here so please do your own research on what may be available in your community.
Cookie Cart: bakery operations (paid), career readiness, workforce skills, and customer service, North Minneapolis
Elpis Enterprises: woodworking, screen printing, and experiential workshops, St. Paul
EMERGE StreetWerks: summer employment program and youth services, Minneapolis
Minnesota Conservation Corps: environmental services, statewide
Minnesota Landscape Arboretum, Urban Garden Youth Employment: entrepreneurship and leadership jobs in a variety of programs for youth age 12 to 19, Metro
Right Track: paid internships and career development opportunities for low-income students, St. Paul
STEP-UP Youth Employment Program: paid internships and career development opportunities for low-income students ages 14-21 in Minneapolis
Youth Express: Saint Paul area program that includes a 15-session ”Urban Apprentice” class and paid internship opportunities at a bike shop or clothing store
Youth Express: Saint Paul area program that includes a 15-session ”Urban Apprentice” class and paid internship opportunities at a bike shop or clothing store
Youth Farm & Market Project: personal development and farming, Minneapolis and St. Paul
YouthLead: services for low-income Ramsey County youth ages 14-21. Includes skill training and employment opportunities.