by Dave Senf
June 2020
Note: All data except for Minnesota’s PMI have been seasonally adjusted. See the feature article in the Minnesota Employment Review, May 2010, for more information on the Minnesota Index.
The Philadelphia Federal Reserve Bank, which produces the Minnesota Leading Index, has temporary suspended generation of state leading indices since the indices are based on data from the time period largely unaffected by the COVID-19 outbreak. The standard approach in estimating the leading indices may not be reliable given the sharp decline in several of the components used in modeling the leading indices.
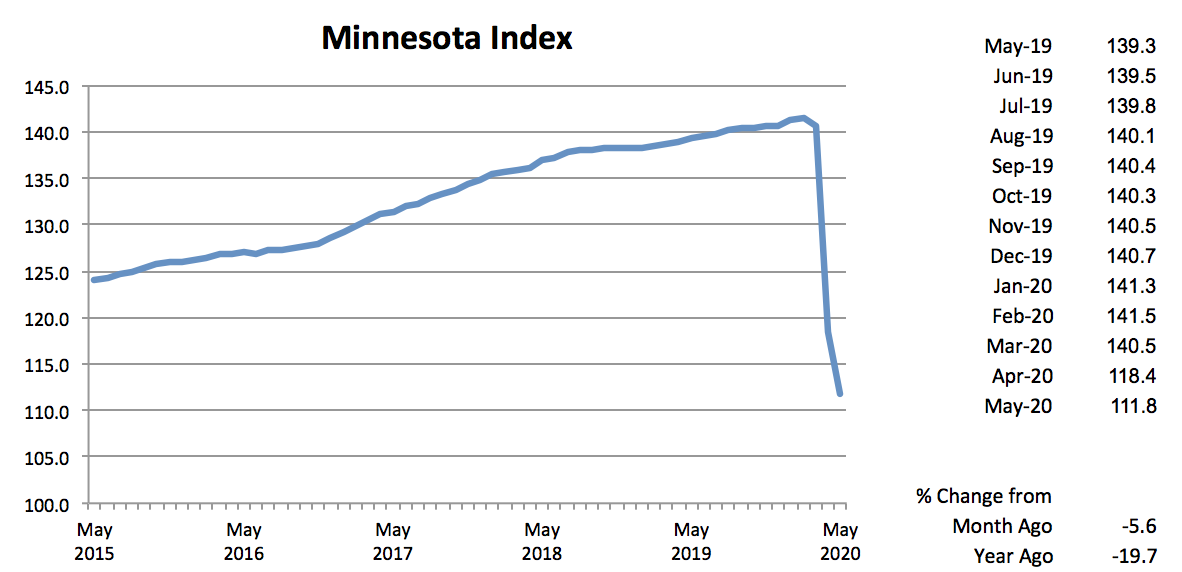
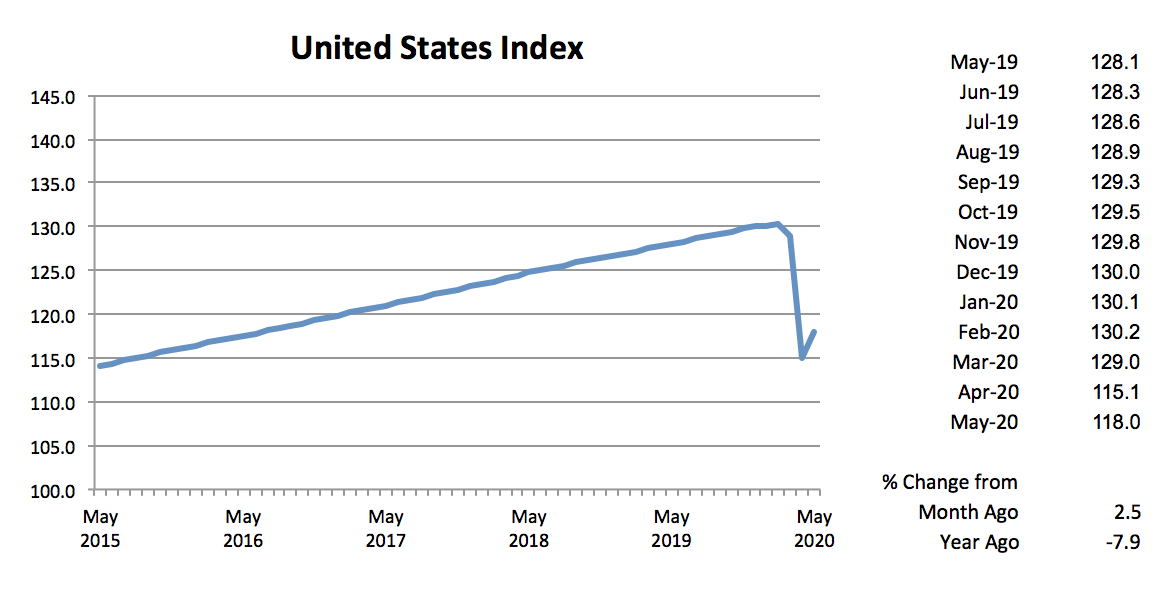
After plunging 15.7 percent in April, the Minnesota Index declined another 5.6 percent in May even though business restrictions to fight the spread of COVID-19 were gradually being lifted. While wage and salary employment increased in May, other components of the index retreated. The state’s unemployment rate increased to a record high of 9.9 percent, and average weekly manufacturing hours set a record low. The U.S. index increased 2.5 percent in May as other states started to reopen earlier than Minnesota.
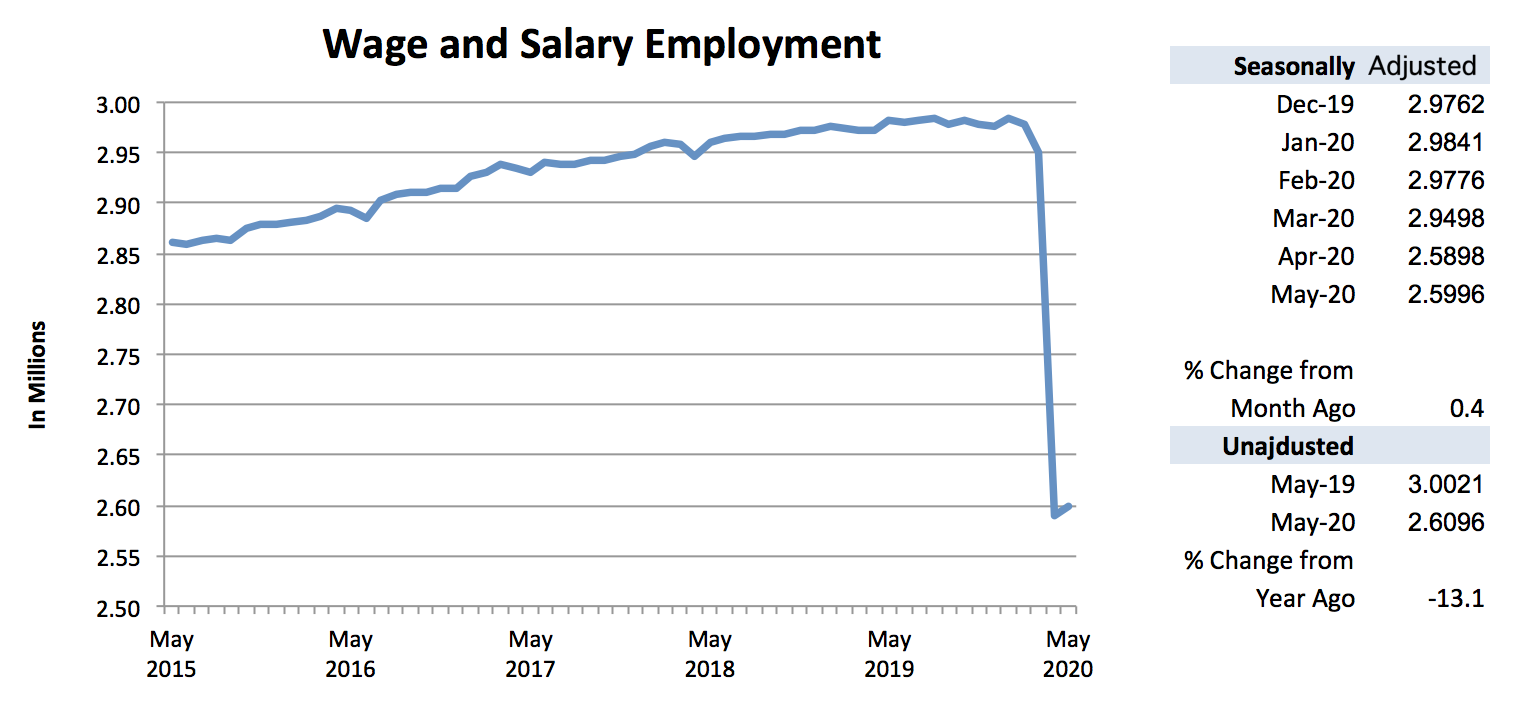
Adjusted Wage and Salary Employment started its long recovery road in May as 9,800 jobs were added. The job gains, however, were only a small percent of the 387,000 jobs lost during March and April. The most promising job growth development was the 27,500 private sector jobs that were added. This was the highest monthly private sector job jump in the 50-year history of the series, but the 1.3 percent increase was far short of the 13.2 percent decline in April. Job gains in the private sector were partly offset by 17,700 job cuts in the public sector. All three levels of government reduced their workforce, but most of the job loss came in local government.
Six of the 11 sectors added jobs in May while five reduced their payroll numbers. Secondary impacts from COVID-19 have begun to show up as job loss in Manufacturing, Mining and Logging, Information, and Financial Activities. Payrolls expanded the most in Leisure and Hospitality, Construction, and Other Services. Leisure and Hospitality, as well as Other Services, suffered steep job loss in April, so the May increases were expected as lockdown restrictions were gradually lifted.
Minnesota’s 0.4 percent job growth in May trailed the 1.9 percent nationwide increase as a number of states opened their economies before Minnesota. Minnesota’s unadjusted over-the-year employment decline remained the same in May at 13.1 percent compared to the U.S. annual 12.0 percent drop.
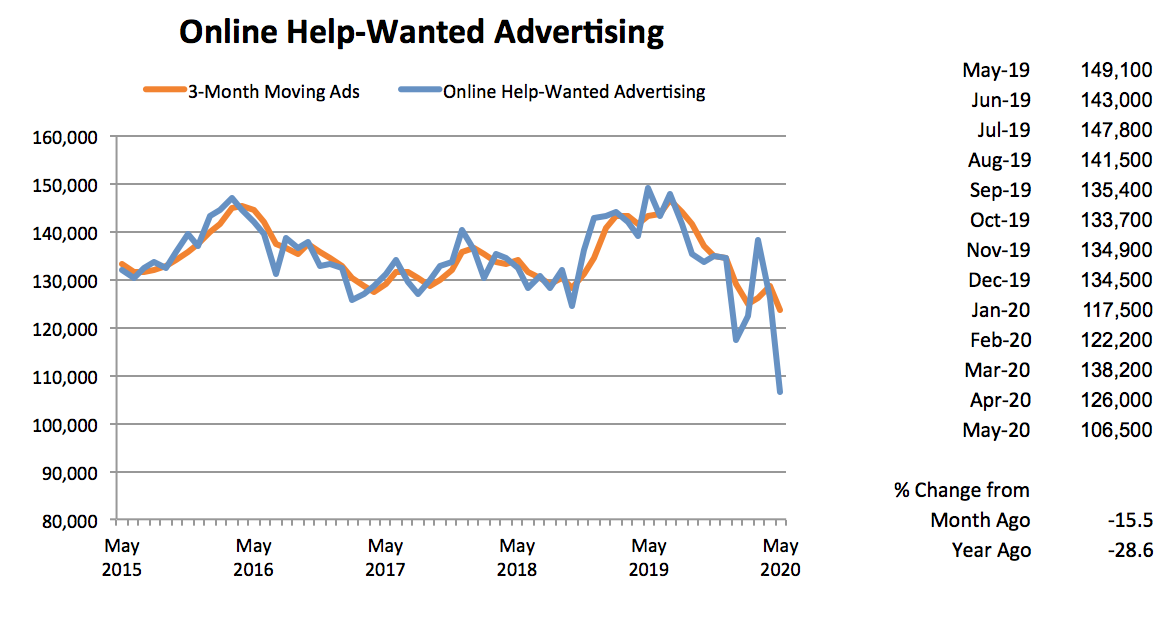
Online Help-Wanted Ads recorded its steepest monthly decline in the 15- year series dropping 15.5 percent to 106,500, while nationally job listings dropped 20.3 percent. Minnesota's May level is the lowest since February 2012 and down 24.4 percent from the annual average in 2019. Minnesota’s share of nationwide online job postings rose to 2.4 percent after reaching a 10-year low of 2.1 percent in January.
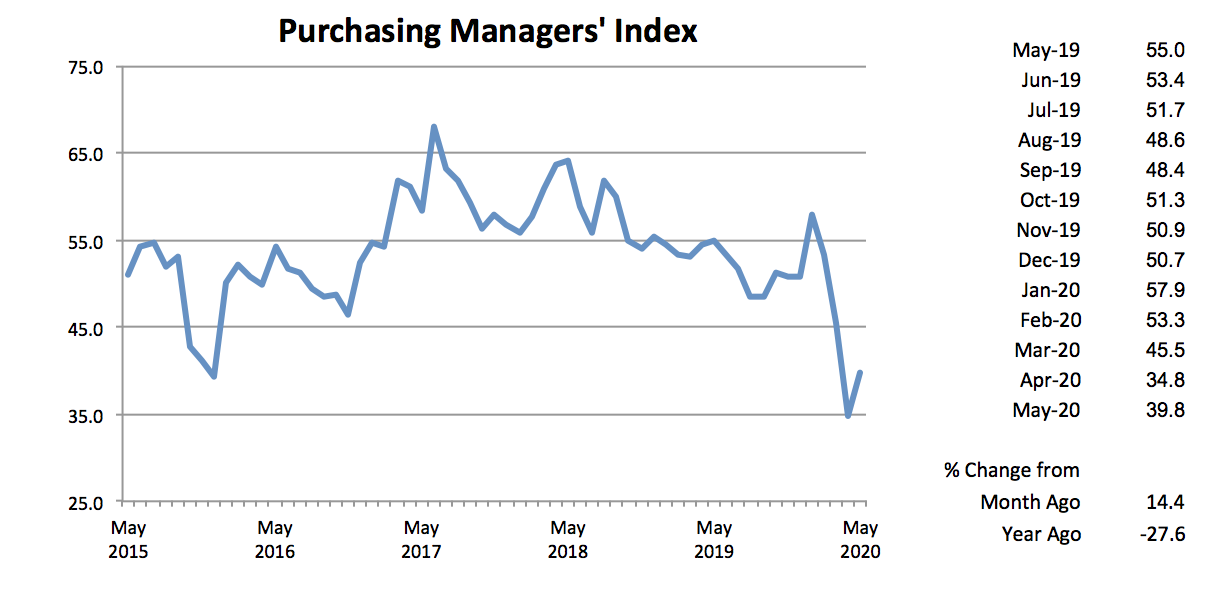
Minnesota’s Purchasing Managers’ Index (PMI) staged a mini rally in May, climbing to 39.8. That reading implies that Minnesota’s Manufacturing sector continued to contract for the third straight month, but the rate of decline slowed from April. The Mid-America Business Index increased to 43.5 and the national PMI rose to 43.1. Minnesota’s Manufacturing activity appears to have been hit harder than other parts of the U.S.
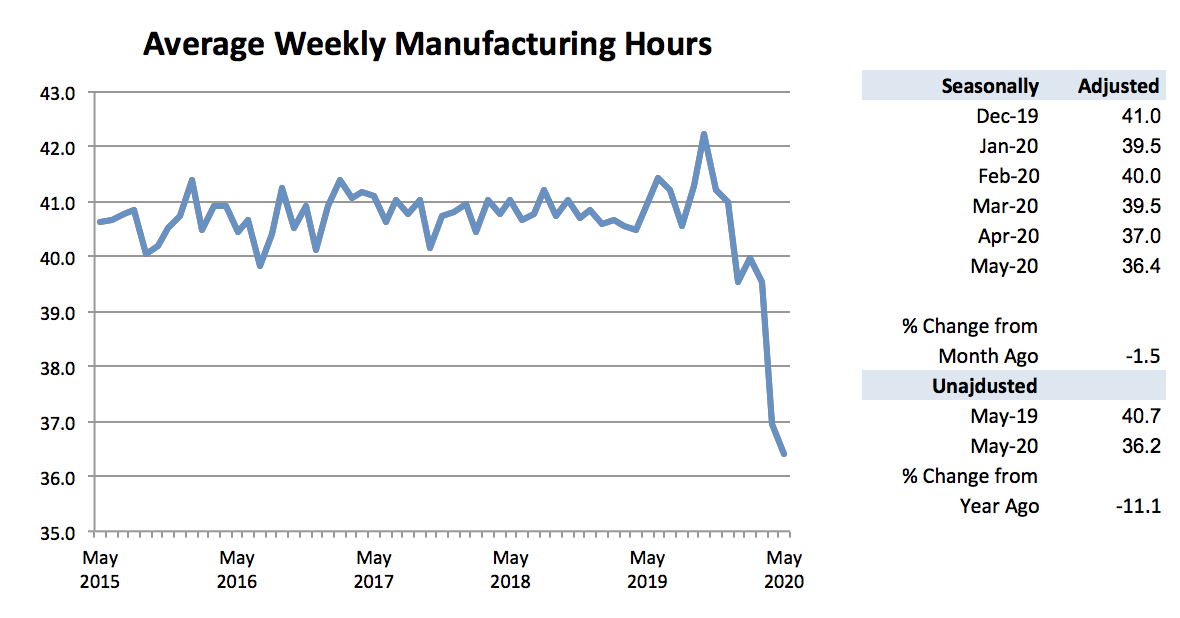
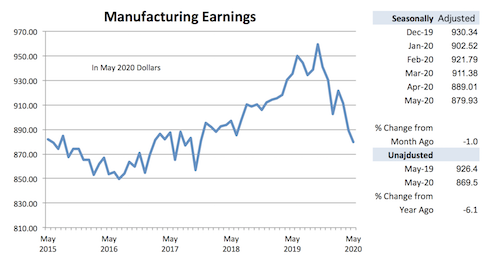
The Manufacturing contraction in the state is also evident in average weekly Manufacturing Hours which reported for the second straight month a record low. The factory workweek dwindled to 36.4 hours in May from April’s 37.0 hours. Manufacturing Earnings declined for the sixth of the last seven months, tailing off to $879.93. That is the thinnest factory paycheck since October 2017 and is down 8.3 percent in real terms from the all-time highest paycheck of $959.21 paid out just last October.
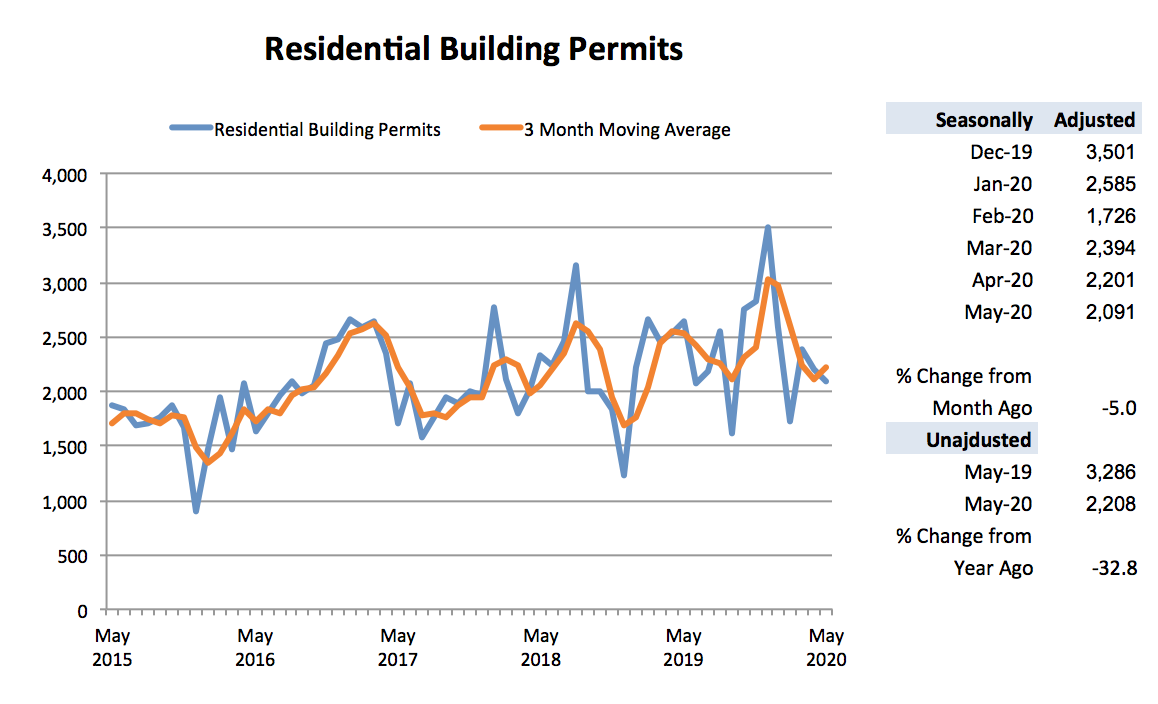
Adjusted Residential Building Permits dropped for the second straight month in May, retreating to 2,091. That level is just slightly below the 50-year average of 2,118. Home building activity in the state and nationwide has been surprisingly resilient given the coronavirus-induced recession. Declining Construction and Manufacturing activity usually lead the economy into recessions. This time around the service sector led the economy down as efforts to control the spread of the virus closed many service-related businesses.
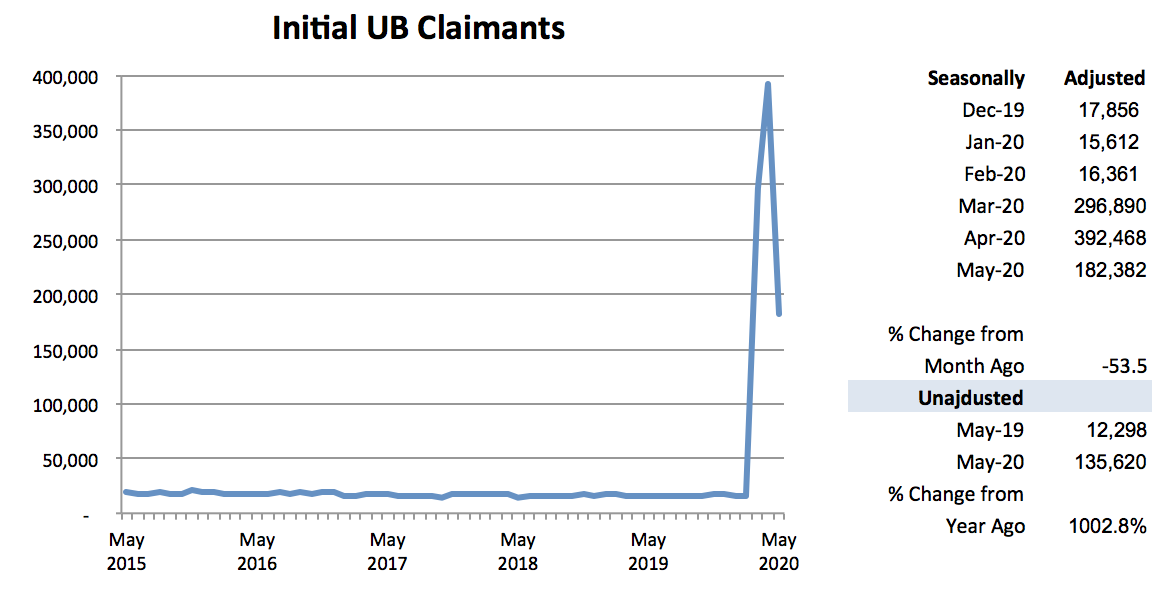
Adjusted Initial Claims for Unemployment Benefits (UB) plunged in May by 53.5 percent to 182,382 but the decline was off the never imagined record high in April. May’s total was the third highest monthly total ever recorded behind March and April and more than four times higher than the pre-coronavirus high. Initial claims continue to run about 10 times the rate of normal times. This indicates that while workers are being recalled to their jobs as restrictions are lifted, other workers continue to be laid off. The abnormal layoff rate will slow the speed of the state’s job recovery.
