February 2019
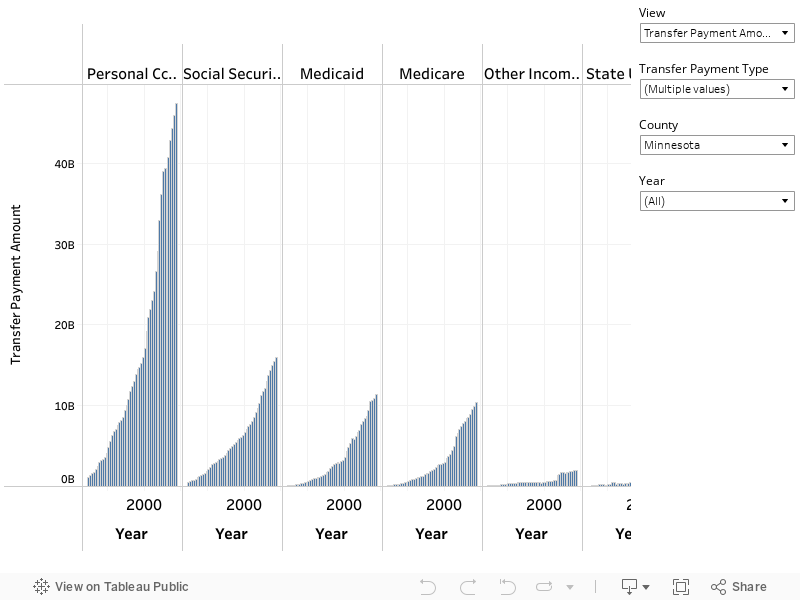
Personal income in Minnesota, as measured by the Bureau of Economic Analysis (BEA), was 2.2 times higher in 2017 than in 1998 without adjusting for inflation. A growing component of personal income, transfer payments – including Social Security, Medicare, Medicaid, Veterans’ Benefits, Earned Income Tax Credit (EITC), and Supplemental Nutrition Assistance Program (SNAP) – climbed 3.1 times higher over the same time period. Transfer payments have gone from 10.8 percent of total personal income in 1998 to 15.6 percent in 2017 in Minnesota. At the national level, transfer payments have climbed from 13.0 percent in 1998 to 17.0 percent in 2017. Transfer payments are expected to continue to account for a higher share of Minnesota’s personal income as the state’s population ages.
Transfer payments as a percent of personal income in 2017 vary from slightly more than 34 percent in Aitkin, Wadena, and Mahnomen counties to less than 11 percent in Carver, Scott, and Washington counties. Transfer payments make up more than 20 percent of personal income in 55 of Minnesota’s 87 counties. The share of personal income accounted for by transfer payments is 13.9 percent in the metropolitan portion of the state and 23.6 percent in the nonmetropolitan portion. County level personal income, grouped into 16 categories, is published by the Bureau of Economic Analysis (BEA).
Below is a Tableau visualization of all 16 transfer payments categories data published by the BEA for 1969 through 2017 for Minnesota and all 87 counties.