by Nick Dobbins
December 2017
Monthly analysis is based on unadjusted employment data.
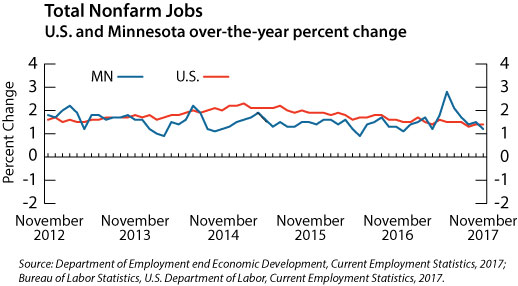
Employment in the Minneapolis-St. Paul MSA was down by 5,688 (0.3 percent) in November. That’s a worse showing than the metro area has historically had in November, but it followed an October where the MSA greatly outperformed the state as a whole. Major job losses came from the expected industries, as Leisure and Hospitality shed 8,929 jobs (4.8 percent), and Mining, Logging, and Construction shed 2,981 (3.5 percent). Trade, Transportation, and Utilities employment grew by 5,884 (1.6 percent) as Retail Trade employers added 5,062 jobs (2.6 percent) in the buildup to the holiday season. Annually the metro area added 41,807 jobs (2.1 percent). November represented the seventh straight month with greater than 2 percent annual employment growth for the MSA, leading Minnesota as a whole and all other MSAs within it. The annual expansion was driven by a broad base of employment growth, as only two supersectors lost jobs - Financial Activities, down 1.2 percent, and Information, down 1.3 percent. Areas with notable growth included Educational and Health Services (up 10,076 or 3.1 percent), Professional and Business Services (up 8,514 or 2.6 percent), Trade, Transportation, and Utilities (up 7,729 or 2.1 percent), and Mining, Logging, and Construction (up 4,580, 5.8 percent). The metro’s over-the-year growth percentage has been higher than the statewide percentage for every month in 2017 so far.
The Duluth-Superior MSA lost 198 jobs (0.1 percent) in November. Leisure and Hospitality was the biggest loser, off by 516 or 3.7 percent. Mining, Logging, and Construction employment was also off by 3.7 percent as the supersector shed 399 jobs. Professional and Business Services suffered notable job loss as well, off by 186 or 2.2 percent. The largest employment increase, by both whole jobs and percentage change, came in Trade, Transportation, and Utilities, which added 536 jobs or 2.1 percent. Over the year the Duluth MSA added 2,064 jobs (1.5 percent), slightly outpacing the state’s 1.2 percent over the year change. Annual growth was driven in large part by the addition of 1,071 jobs (11.4 percent) to Mining, Logging, and Construction. Other notable growth supersectors included Financial Activities (up 210 or 3.6 percent) and Trade, Transportation, and Utilities (up 388 or 1.5 percent).
Employment in the Rochester MSA was off by 432 (0.4 percent). In addition to the usual suspects losing jobs (Mining, Logging, and Construction was off by 3 percent, and Leisure and Hospitality was off by 2.2), Manufacturing employment also contracted, losing 334 jobs or 3.1 percent. Trade, Transportation, and Utilities added 164 jobs (0.9 percent), but Transportation, Warehousing, and Utilities saw slightly stronger proportional growth than Retail Trade, up 1.1 percent and 1 percent, respectively. Annually Rochester added 311 jobs (0.3 percent). Mining, Logging, and Construction had the strongest growth in both real and proportional numbers, adding 304 jobs or 6.7 percent. Educational and Health Services had the steepest decline, both real and proportional, off by 535 jobs or 1.1 percent.
Employment in the Saint Cloud MSA was off by 152 (0.1 percent) in November. Mining, Logging, and Construction (down 364,or 4.7 percent), Educational and Health Services (down 155 or 0.7 percent) and Other Services (down 29, 0.8 percent) were among the notable contractions in the MSA. Trade, Transportation, and Utilities was the prominent growth industry, adding 355 jobs or 1.6 percent. Annually the Saint Cloud MSA added 1,841 jobs (1.7 percent). Small losses of less than 100 jobs each in five supersectors were counterbalanced by larger gains across the other industry groups. Notable among those were Educational and Health Services (up 1,000 or 4.6 percent) and Mining, Logging, and Construction (up 617 or 9.2 percent).
The Mankato-North Mankato MSA lost 415 jobs (0.7 percent) in November. It was the largest proportional over-the-month decline of any MSA in the state. The loss came entirely from service providers, which lost 416 jobs (0.8 percent), while goods producers went on a hiring spree, adding 1 jobs (0.0 percent). The declines among service providers were concentrated in the private sector, as public sector employment grew by 123 (1.1 percent) on the month. Annually the MSA added 1,085 jobs (1.9 percent). Goods producers added 389 (3.9 percent) while service providers added 696 (1.4 percent). Both private and public sector employment grew on the year.
The Fargo-Moorhead MSA lost 655 jobs (0.4 percent) in November. Mining, Logging, and Construction saw the sharpest decline, off by 411 jobs or 3.9 percent. The largest gains came in Trade, Transportation, and Utilities, which added 326 jobs (1.1 percent), almost entirely from the Retail Trade component. Annually the MSA added 1,837 jobs (1.3 percent). The only supersectors to shed jobs were Information (down 104 or 3.2 percent) and Trade, Transportation, and Utilities which lost 447 jobs (1.4 percent) entirely from a steep over-the-year decline of 671 (4 percent) in Retail Trade.
The Grand Forks-East Grand Forks MSA lost 63 jobs (0.1 percent) in November. Mining, Logging, and Construction saw the largest declines, off by 197 jobs or 5.5 percent. Annually the MSA lost 1,633 jobs (2.7 percent). It remained the only MSA in the state to lose jobs over-the-year. The struggles continued to stem from the over-the-year loss of 1,113 (24.7 percent) in Mining, Logging, and Construction.
