by Dave Senf
July 2017
Note: All data except for Minnesota’s PMI have been seasonally adjusted. See the feature article in the Minnesota Employment Review, May 2010, for more information on the Minnesota Index.
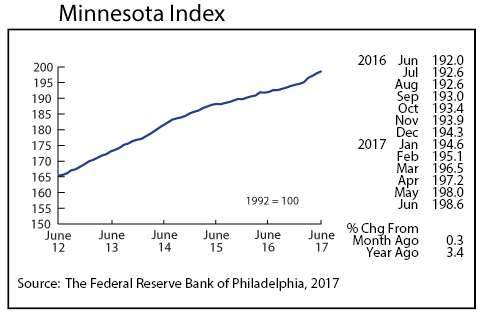
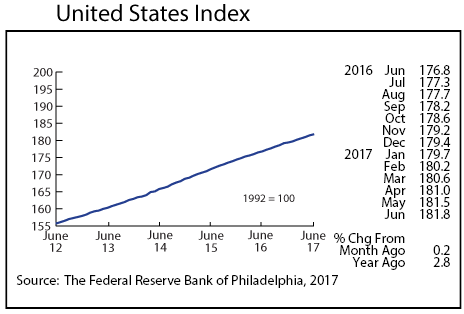
The Minnesota Index advanced 0.3 percent in June which is still above the 38-year average of 0.2 percent but is lower than the previous three months. The U.S. index rose 0.2 percent in June. The Minnesota Index combines four state-level indicators to summarize current economic activity in the state. The four state-level indicators are nonfarm wage and salary employment, average weekly manufacturing hours, statewide unemployment rate, and wage and salary disbursements adjusted for inflation.
Minnesota’s index is up 3.4 percent over the year, topping the U.S. over-the- year increase of 2.8 percent. Through the first six months of the year the index is up 2.2 percent which is the highest increase for the first half of the year since 2014. The strong showing by the Minnesota Index during the first half of the year implies that Minnesota’s economy has gained momentum and is expanding at its quickest rate in over two years.
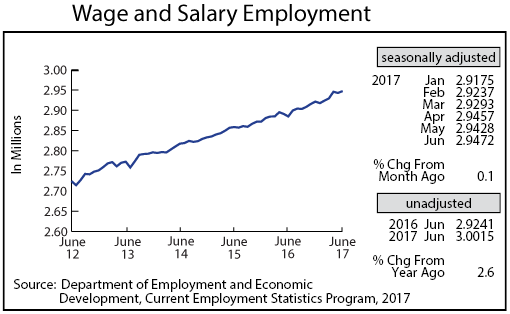
Minnesota’s adjusted Wage and Salary Employment bounced back from losing 2,900 jobs in May to add 4,400 in June. The private sector upped payroll numbers by 2,900 while public sector jobs expanded by 1,500. Leisure and Hospitality, Professional and Business Services, and Manufacturing added the most jobs. Job cutbacks were heaviest in Educational and Heath Services, Other Services, and Financial Activities.
Manufacturing jobs jumped by 2,100 which is the highest monthly gain since August 2011. Most of the manufacturing job gain was in Durable Goods Manufacturing industries as Durable Goods Manufacturing firms added 1,700 jobs, the highest monthly job expansion since December 2004. Minnesota’s unadjusted over-the-year job growth spiked to 2.6 percent, a jump that hasn’t been seen since September 2011. U.S. jobs were up 1.5 percent from a year ago. Minnesota has averaged 1.7 percent job growth through the first half of the year compared to 1.5 percent nationally.
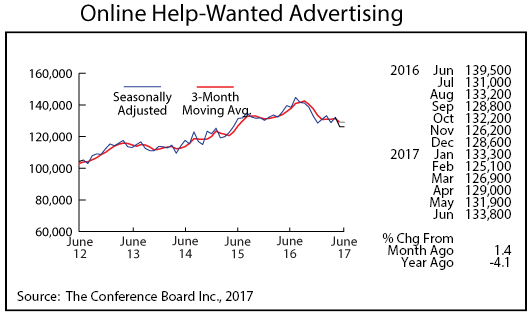
Online Help-Wanted Ads rose for the fourth consecutive month to 133,800 in June. June’s 1.4 percent gain in Minnesota topped the 1.0 percent national decline in online job postings. Minnesota’s share of national online job advertising rose to 2.8 percent for the second time in the 12-year history of tracking online job ads. Minnesota’s share of job ads continues to run above its share of wage and salary employment, 2.0 percent in June. Hiring demand remains solid in the state.
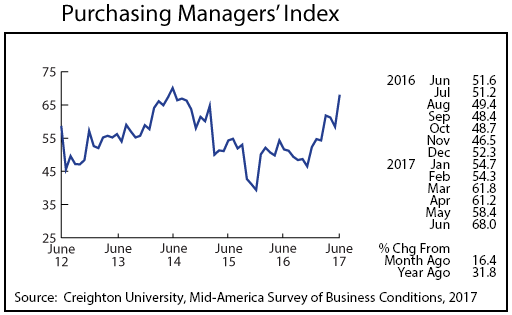
Minnesota’s Purchasing Managers’ Index (PMI), after dipping the previous two months, surged in June to 68.0. June’s robust reading was the highest in three years and consistent with the spurt of manufacturing hiring in June. Manufacturing, after slowing in 2015 and 2016 as a strong dollar and weak global economy reduced export activity, is currently benefiting from a weaker dollar and stronger worldwide economy. The corresponding national index rose to 57.8 while the Mid-American index increased to 62.3. The employment component of Minnesota’s index continued to run positive, topping 60 for the fourth month in a row and suggesting that manufacturing payroll numbers will continue to increase over the next few months.
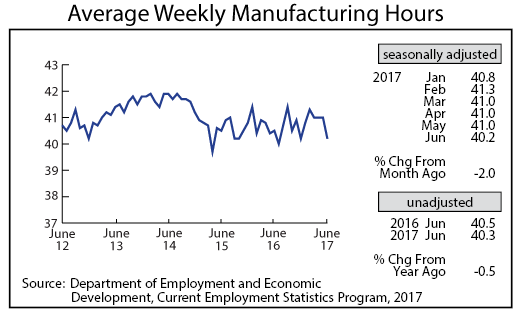
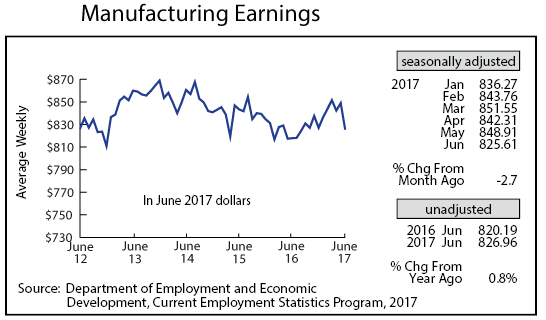
Adjusted Manufacturing Hours surprisingly dropped to 40.2, falling below 41 hours per week for the first time in five months. This number will be revised next month so look for an increase given all the other strong manufacturing indicators. Average weekly Manufacturing Earnings also unexpectedly declined in June to an 11-month low of $825.61. June’s factory earnings are also likely to be revised upwards next month given other signs pointing towards an ongoing solid rebound in manufacturing activity.
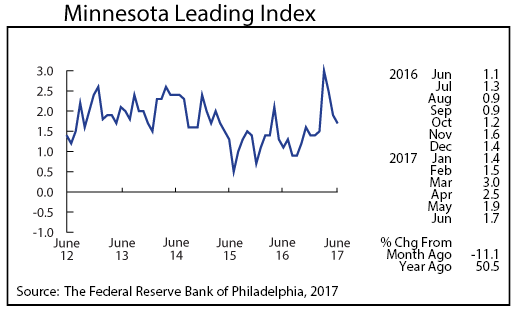
After reaching a seven-year high in March, the Minnesota Leading Index slipped for the third consecutive month in June. June’s 1.7 reading, however, remains healthy, signaling solid economic expansion in the state for the rest of the year. Minnesota’s leading index topped the U.S. leading index for the fifth straight month.
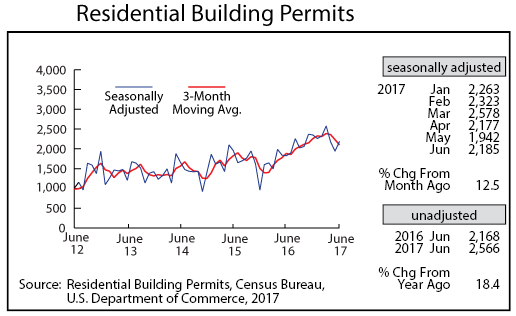
After dipping the last two months, adjusted Residential Building Permits rebounded partially in June, climbing to 2,185. June’s permit level is just slightly above the 47-year monthly average of 2,097. Home building permits peaked in 2004, bottomed out in 2009, and have since slowly recovered to near normal levels in 2017.
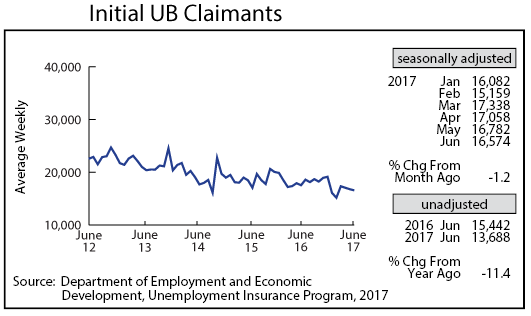
Adjusted Initial Claims for Unemployment Benefits (UB) inched down for the third consecutive month to 16,574. Initial claims are likely to fall below 200,000 for the year making 2017 only the ninth time since 1970 with initial claims totaling less than 200,000. The last two years were in 1998 and 1999. The other years were all in the 1970s when employment was roughly half the size of the current total.
