by Dave Senf
May 2016
Note: All data except for Minnesota’s PMI have been seasonally adjusted. See the feature article in the Minnesota Employment Review, May 2010, for more information on the Minnesota Index.
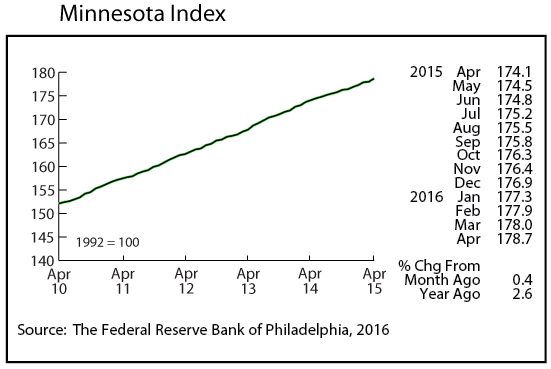
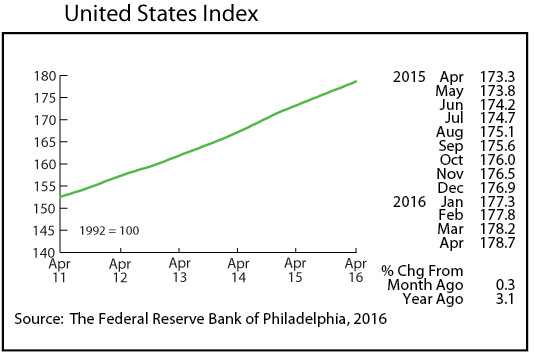
The Minnesota Index, after advancing only 0.1 percent in March, surged in April by 0.4 percent. The April jump was the highest since March 2015. The 0.5 percent spike in nonfarm wage and salary employment was behind the index’s advance. Minnesota’s monthly change has averaged 0.3 percent over the last five years, so the 0.4 percent suggests that Minnesota’s economy has accelerated. The U.S. index increased 0.3 percent in April and is up 3.1 percent from a year ago. The Minnesota index is up 2.6 from last April. Year-over-year growth by the Minnesota index has lagged behind U.S. index growth for 12 straight months.
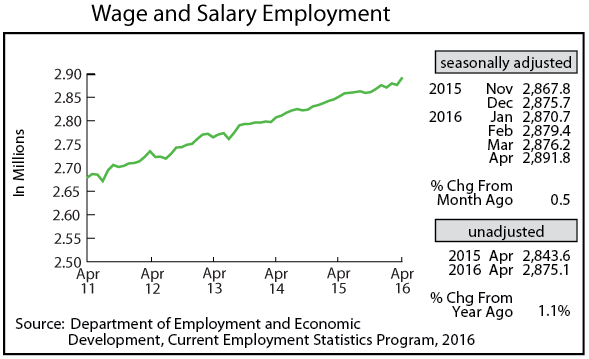
Adjusted Wage and Salary Employment skyrocketed by 15,600 jobs in April, the largest monthly gain since September 2013 when payrolls increased by 15,700. All of the employment increase was in the private sector as public payrolls dipped by 300 jobs. The 15,900 private sector job increase was the highest private sector gain since April 2005. The only other supersector besides Government with declining payroll numbers was Information. Job creation was highest in Professional and Business Services, Trade, Transportation, and Utilities, and Manufacturing. Manufacturing firms added 1,900 workers in April, the highest monthly gain since July 2011. Minnesota’s unadjusted over-the-year job growth, however, slipped to 1.1 percent in April, the lowest over-the-year gain in five months. Minnesota’s over-the-year increase fell short of the U.S. pace again in April as the U.S. annual increase was 1.9 percent. Minnesota’s unadjusted over-the-year job growth has trailed the U.S. growth rate for 29 of the last 30 months.
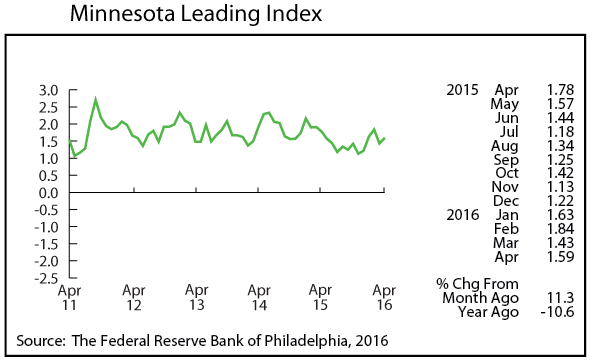
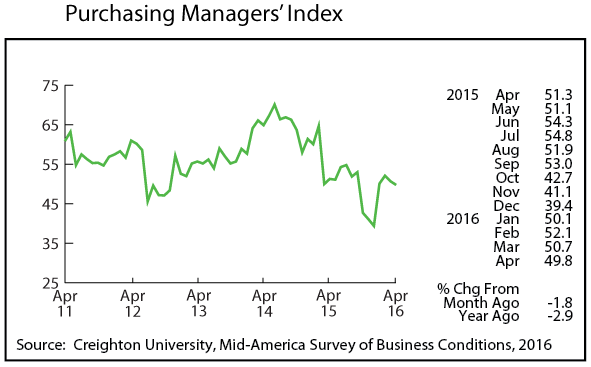
Minnesota’s Purchasing Managers’ Index (PMI), unlike most of the other indicators, continues to signal a weak economy in Minnesota as the index fell below the growth neutral 50 reading to 49.8 in April. April’s reading was the fourth time over the last seven months that the state’s PMI was below 50. Minnesota’s reading was slightly lower than the nine-state Mid-America Business Index (50.0) and the U.S. ISM (50.8). All three industry indices point towards lackluster performances by manufacturers across most of the nation. The 1,900 manufacturing jobs added by Minnesota manufacturers in April is inconsistent with the low Minnesota PMI. Either manufacturing job numbers will be revised downward next month or the state’s PMI should head upward over the next few months.
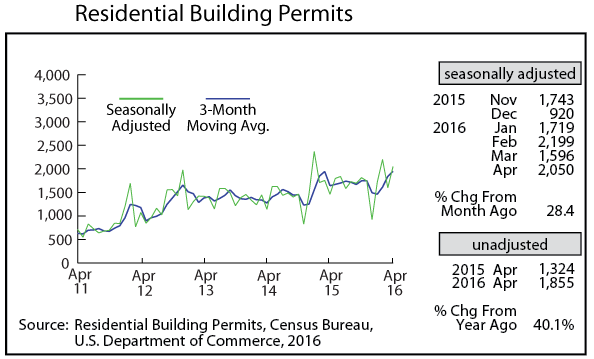
Adjusted Residential Building Permits bounced back in April, jumping to 2,050. Building permits are up 3.7 percent through the first four months of 2016 compared to last year, suggesting that Minnesota’s home building market continues to gain ground gradually.
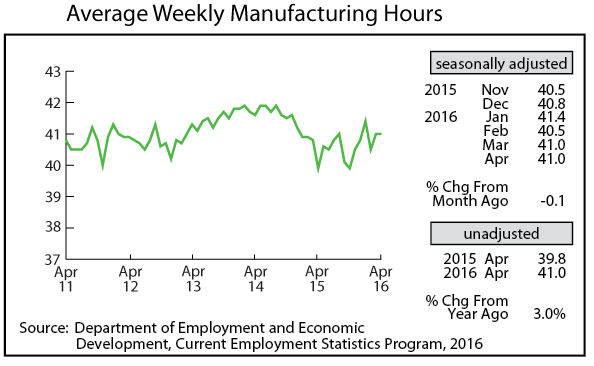
April’s adjusted Manufacturing Hours were virtually unchanged from March, coming in at 41.0 hours. The factory workweek has averaged 41.0 hours per week over the first four months of 2016 which is up from the 40.6 hours averaged in 2015 but still significantly lower than the 41.7 hours averaged in 2014. The uptick in hours may be an indicator that Minnesota’s manufacturing sector is starting to pick up.
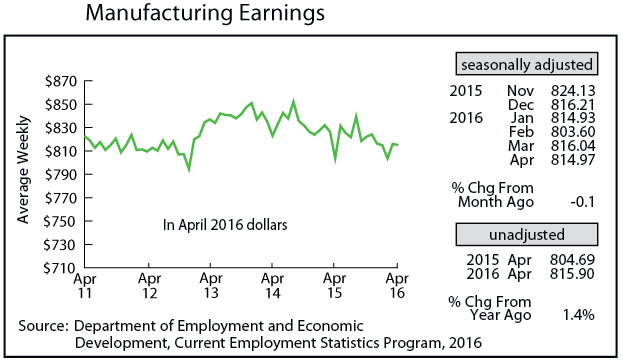
Average weekly Manufacturing Earnings dipped slightly in April to $814.97. Despite the decline, April’s factory paycheck was the first real over-the-year increase in 19 months.
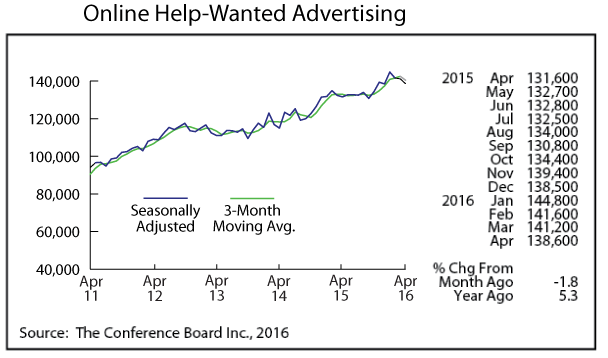
Online Help-Wanted Ads dipped for the third month in a row in April, tailing off to 138,600, the lowest level since last December. Online job advertising was down 1.8 percent in Minnesota in April while up 0.8 nationally. Minnesota’s 2.7 percent share of online help-wanted ads remains well above the state’s 2.0 percent of wage and salary employment, indicating that demand for workers in the state continues to be strong.
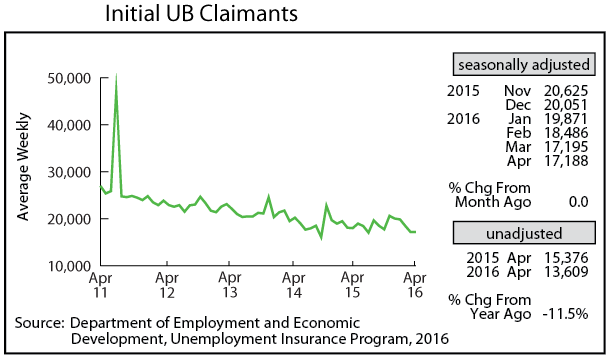
Adjusted Initial Claims for Unemployment Benefits (UB) barely changed in April, inching down from 17,195 in March to 17,188. Initial claims remain close to record low levels indicating that Minnesota employers are more interested in hiring than in laying off workers. April was the 69th month in a row in which Minnesota’s payroll employment recorded growth over the year. That is the third longest stretch of over-the-year job growth for the state with data going back to 1951. The record setting stretch of 216 months was set between 1983 and 2001. The second longest streak of robust job growth was 107 months between 1961 and 1970. Job growth after the 2001 recession was positive over the year for only 49 straight months, between 2004 and 2008, before the Great Recession hit.