by Nick Dobbins
February 2019
Monthly analysis is based on seasonally adjusted employment data. Yearly analysis is based on unadjusted employment data.*
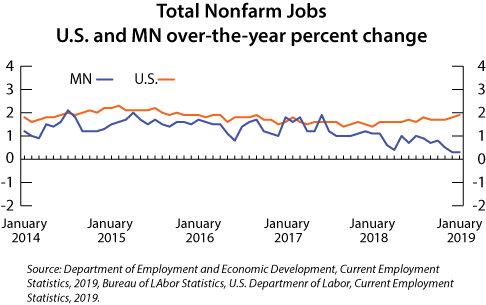
Employment in the Minneapolis-St. Paul-Bloomington MSA was off by 31,121 (1.6 percent) in January. While at first glance this appears to be a steep decline, it is very much in line with the usual monthly job losses in January. The losses were spread across most supersectors, although notable declines included Professional and Business Services, off by 10,271 or 3.2 percent, more than half of which came via the Employment Services industry, and Trade, Transportation, and Utilities, off by 9,089 or 2.4 percent, most of which came from the Retail Trade sector. As one of only two supersectors to add jobs on the month, Leisure and Hospitality bucked its own tradition of over-the-month losses, adding 710 jobs (0.4 percent). This is the only January on record with positive growth in the supersector. The metro area lost 505 jobs (0.0 percent) on an over-the-year basis. While small, it was the first month of over-the-year job losses for the area since July of 2010. The declines were concentrated in a couple of supersectors. Professional and Business Services lost 6,783 jobs (2.1 percent) thanks to a decline of 7,210 (6.7 percent) in Employment Services. Government employers lost 1,755 jobs (0.7 percent), with losses in Federal and Local Government.
The Duluth-Superior MSA lost 2,978 jobs (2.2 percent) in January. Every published supersector lost jobs on the month, with the steepest declines coming in Leisure and Hospitality (down 466 or 3.3 percent), Educational and Health Services (down 610, 1.9 percent), and Trade, Transportation, and Utilities (down 468, 1.9 percent, with losses in all three component sectors). Over the year, employment in the Duluth MSA was mostly flat, off by eight jobs (0.0 percent). Declines in Educational and Health Services (425, 1.3 percent), Financial Activities (183, 3.2 percent), and Leisure and Hospitality (235, 1.7 percent) were mostly offset by gains in Professional and Business Services (up 384 or 5.2 percent) and Manufacturing (up 254, 3.3 percent).
Employment in the Rochester MSA was down by 1,346 (1.1 percent) in January. Government employers led the job losers, off by 325 jobs or 2.4 percent, thanks in large part to the loss of 283 jobs (2.6 percent) from Local Government employers. Educational and Health Services lost 316 jobs (0.6 percent), and Trade, Transportation, and Utilities lost 267 (1.5 percent). Over the year the Rochester area added 2,058 jobs (1.7 percent). Manufacturing employers added 561 jobs (5.4 percent), and Leisure and Hospitality added 608 (5.8 percent). The largest growth in terms of jobs added was Professional and Business Services, which added 652 jobs (1.3 percent). The Information supersector lost 162 jobs (9.2 percent) on the year.
Employment in the Saint Cloud MSA was off by 1,550 (1.4 percent) in January. Trade, Transportation, and Utilities lost 602 jobs (2.6 percent) with notable losses in all three component sectors. The only supersector to add jobs on the month was Financial Activities, which was up by 22 (0.4 percent). Annually the area added 1,521 jobs (1.4 percent). Educational and Health Services led the way, adding 947 jobs (4.4 percent), while Manufacturing added 369 jobs of its own (up 2.5 percent). Trade, Transportation, and Utilities was down by 390 (1.7 percent), and Leisure and Hospitality was down 210 (2.6 percent).
The Mankato-North Mankato MSA lost 2,238 jobs (3.8 percent) in January. The private sector lost 2,074 jobs (4.2 percent) while the public sector lost 164 (1.6 percent). Service providers lost 1,751 jobs (3.6 percent), and goods producers lost 487 (4.7 percent). Annually the Mankato-North Mankato MSA lost 428 jobs (0.7 percent). The private sector lost 594 jobs (1.2 percent), but government employers added 166 (1.7 percent). Goods producers added 85 jobs (0.9 percent), but those gains were erased by the loss of 513 jobs (1.1 percent) among service providers.
Employment in the Fargo-Moorhead MSA was down by 3,584 (2.5 percent) in January. Government employers lost 1,321 jobs (6.5 percent); Leisure and Hospitality lost 689 (5 percent). The only supersector in the area to add jobs on the month was Educational and Health Services, up by 1 (0.0 percent). Annually the Fargo-Moorhead area lost 157 jobs (0.1 percent). Trade, Transportation, and Utilities lost 340 jobs (1.1 percent), and Leisure and Hospitality lost 572 (4.2 percent). Losses were stemmed somewhat by the addition of 690 jobs (2.8 percent) in Educational and Health Services.
The Grand Forks-East Grand Forks MSA lost 838 jobs (1.5 percent) in January. Trade, Transportation, and Utilities lost 342 jobs (3 percent), and Mining, Logging, and Construction lost 154 (5.9 percent). In fact, every published supersector and component sector in the MSA lost jobs on the month. Annually the Grand Forks-East Grand Forks MSA lost 720 jobs (1.3 percent). Among the notable areas of negative growth were Government (off by 512, 3.6 percent), Leisure and Hospitality (off 283, 4.5 percent), and Trade, Transportation, and Utilities (off 313, 2.8 percent). The largest proportional growth came in Professional and Business Services (up 148 or 4.5 percent).
