by Mustapha Hammida
March 2015
Minnesotans who lost or quit jobs during the recession generally landed new jobs that paid less. After the recession, however, wage outcomes improved.
The Great Recession and ensuing recovery caused significant fluctuations in Minnesota's labor market. Minnesota's seasonally adjusted unemployment rate climbed from 4.8 percent in December 2007 to 8.3 percent in June 2009 and has since leveled off at 3.7 percent in February 2015. Minnesota lost 149,600 jobs during the recession and has since gained them all back, surpassing the pre-recession peak by more than 57,800 jobs as of February 2015.
These fluctuations in the labor market have heightened interest in job quality. Did the labor market become more polarized during the recession and not fully recover since, as recent Federal Reserve Bank research suggests?1. If so, are workers who lose or quit a job able to find another job with equivalent wages? This article addresses the question of wage outcomes resulting from both voluntary and involuntary job mobility in Minnesota. Another way to frame the question is what types of jobs are being destroyed and created as people move from one job to another?
To answer these questions, we will assess whether the distributions of hourly wages of jobs lost and jobs created changed between two periods, the Great Recession and the recovery. The goal of this research is to improve our understanding of the relationship between job mobility and job quality as measured by hourly wages of these jobs in Minnesota.
The study group for this research is Minnesota workers with a job separation and new job within a three-quarter time frame in two time periods (see methodology section for more details). The two time periods are the Great Recession period spanning third quarter 2008 to second quarter 2009 and the recovery period spanning third quarter 2012 to second quarter 2013.
Table 1 summarizes the study groups, comparing the number with a separation job and the number with a new job across the two time periods. As expected, the number of workers with a separation job during an average quarter decreased during the recovery. In addition, the number of workers who found a job after separation increased during the recovery. Overall, within three quarters of a job loss, an average worker during the Great Recession had around a 50 percent chance of finding another job, while an average worker during the recovery had close to a 60 percent chance of finding another job.
| Distribution of Workers with a Separation Job by Worker Type and Time Period | ||||
|---|---|---|---|---|
| Type of Worker | Average Quarter of
2008 Q3 - 2009 Q2 (Recession Period) |
Average Quarter of
2012 Q3 - 2013 Q2 (Recovery Period) |
||
| Total | Percent | Total | Percent | |
| Workers with a Separation Job | 221,444 | 100.0 | 216,533 | 100.0 |
| Workers with a New Job | 113,537 | 51.3 | 126,890 | 58.6 |
| Workers without a New Job after Two Quarters | 107,908 | 48.7 | 89,644 | 41.4 |
| Source: DEED, Unemployment Insurance Wage Records | ||||
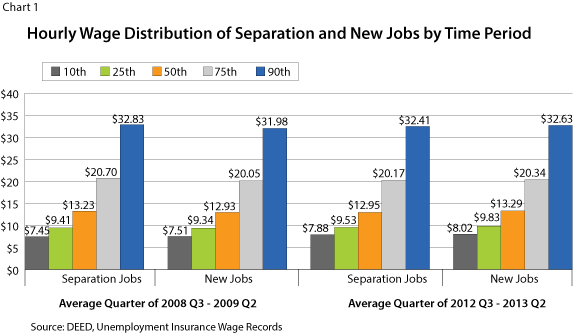
How do the wages of new jobs compare to those of separation jobs? During the recession, an average worker who lost a job found a lower-paying job (see Chart 1). Breaking this out by percentile, except for the lowest (10th) percentile, all four higher wage percentiles declined. For instance, half of the new jobs paid $12.93 or less per hour, while half of the separation jobs paid $13.23 or less per hour. Moving to the top sections of the wage distributions, the 75th percentile hourly wage was $20.05 compared to $20.70 for separation jobs.
Although the wage percentiles of new jobs overall were lower than comparable wage percentiles of separation jobs, it was at the higher hourly wages of the distribution that they fell furthest behind. These results indicate that, during the recession, the rate of decline in wages of new jobs relative to separation jobs was only 0.7 percent at the 25th percentile, but 2.3 percent at the 50th percentile and 3.2 percent at the 75th percentile.
Now, consider the relationship between job mobility and wages during the recovery (see right half of Chart 1). A strikingly different picture emerges here. In all five percentiles, wages for new jobs were higher than wages for separation jobs. For example, the median hourly wage of new jobs was $13.29, while the median hourly wage of separation jobs was $12.95. This means that during the recovery period, in general, workers who lost jobs were able to find new jobs at higher wages.
Moreover, wage improvements were stronger at the lower half of the wage distribution of new jobs than at the top half during the recovery. Wages of new jobs relative to separation jobs were 3.1 percent higher at the 25th percentile, 2.6 percent higher at the 50th percentile, and only 0.9 percent higher at the 75th percentile during the recovery. To put this in perspective, however, in dollars and cents terms, wages improved between 14 and 34 cents across the distribution, and it was the middle of the distribution that saw the bigger increases.

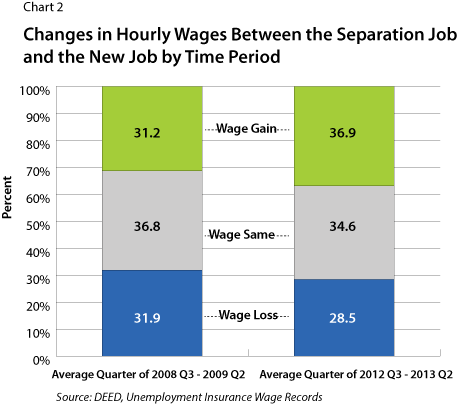
This section looks at the effect of job mobility on wages and how it differs between the Great Recession and the recovery. Comparing the wages of separation and new jobs for each worker, the analysis disaggregates the pool of workers with job-to-job transitions into three groups: those with hourly wage losses, those with relatively similar wages and those with hourly wage gains.
Chart 2 shows that during the Great Recession about 37 percent of workers experienced no changes in their hourly wages as a result of job mobility. The remaining 63 percent were almost evenly distributed among the other two groups: 32 percent experienced losses in hourly wages while 31 percent experienced gains.
As the economy recovered, the wage effect of job mobility in all three categories of workers improved. During the recovery, the share of workers with hourly wage losses was down 3 percentage points to 29 percent, the share of workers with no changes in their hourly wages was down 2 percentage points to 35 percent, and the share of workers who commanded hourly wage gains was up 6 percentage points to 37 percent.

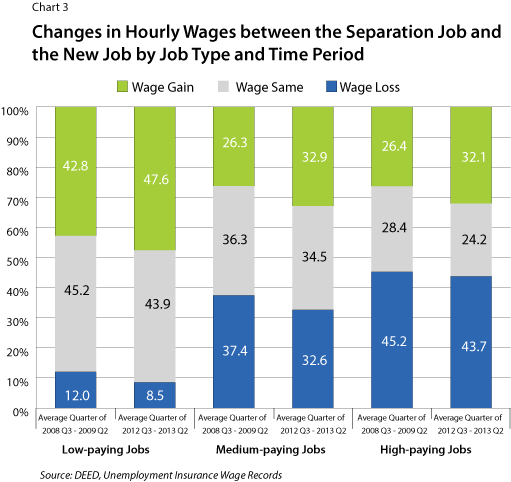
Have the effects of job mobility on wages improved across all types of jobs? To tackle this question, this analysis breaks jobs into three categories: low-paying, under $10 an hour; medium-paying, between $10 and $19.99; and high-paying, $20 or more.

Three effects are apparent in Chart 3. First, the higher the hourly wage of the separation job, the higher the chances of experiencing a wage cut in the hire job. During the Great Recession, an average worker separating from a high-paying job had a 45 percent chance of taking a loss in hourly wages after reemployment. In contrast, the chance of a wage cut was 37 percent and 12 percent for average workers separating from a medium-paying job and from a low-paying job, respectively.
Second, the higher the hourly wages of the separation job, the lower the chances of returning to a new job that pays close to the same hourly wage. During the Great Recession, an average worker separating from a low-paying job had a 45 percent chance of returning to another low-paying job with no changes in hourly wages. The changes for medium- and high-paying job holders were 36 percent and 28 percent, respectively.
Third, the proportion of workers whose wages increased due to job mobility is more pronounced in the low-paying jobs category than in the medium- or high-paying jobs categories. An average worker separating from a low-paying job had a 43 percent chance of securing a new job with higher hourly wages during the Great Recession. Workers who separated from medium- or high-paying jobs, however, had only a 26 percent chance of moving into a new job that offered wage gains during the Great Recession.
The same pattern applies to the recovery period but with significant improvements in all three types of jobs. As workers transitioned from job to job during the recovery period, the proportion of workers with no change or losses in hourly wages declined from the recessionary period and the proportion of workers with gains in hourly wages rose. Moreover, the average worker separating from a high-paying job had a 32 percent chance (up 6 percent) of getting a new job paying higher hourly wages and a 44 percent chance (down 1 percent) of taking a reduction in hourly wages at the new job.
Likewise, an average worker separating from a low-paying job during the recovery period fared much better than a similar worker during the Great Recession, with a 48 percent chance (up 5 percent) of experiencing increases in hourly wages and only an 8 percent chance (down 4 percent) of experiencing a wage decrease in the new job.
Like the other two types of workers, an average worker separating from a medium-paying job during the recovery faced much better job opportunities than an average worker separating from a medium-paying job during the Great Recession. In fact, the average worker had a 33 percent chance (up 7 percent, the largest increase of all three worker types) of experiencing a gain in hourly wages and a similar chance (down 5 percent, again the largest drop of all three worker types) of taking a new job with lower hourly wages.
This article sheds light on the relationship between job mobility and job quality and its importance in assessing the health of the Minnesota labor market. Using hourly wages as our measure of job quality, we establish that job mobility affects hourly wages differently across the business cycle. During the Great Recession, workers who experienced a job separation faced a supply of new jobs that, in general, were paying hourly wages that were slightly lower than those of separation jobs. As the economy recovered, workers had better chances of seeing gains in their hourly wages when they moved to new jobs.
Moreover, the extent of these trends varied by the quality of jobs. Workers who separated from low-paying jobs had over an 85 percent chance of not losing ground in hourly wages as a result of job mobility. In contrast, that same chance was only about 55 percent for workers who separated from high-paying jobs. Differences aside, the recovery is lifting most workers regardless of the job type.
A word of caution is necessary regarding these results. Our findings are based on data for workers with a job-to-job transition within a three-quarter window. It is likely that workers with job transitions over a longer period than the one considered here encounter different hourly wage outcomes. Expanding the study population to include workers with job transitions over a longer period, such as the long-term unemployed, would complement our current results. We plan to complete that analysis once enough quarters of data become available.
MethodologyData We use data from the quarterly Unemployment Insurance Wage Records (UIWR). These data represent a census of all jobs covered under the Minnesota Unemployment Insurance Program, although self-employment, independent contractors and federal government jobs are excluded. The UIWR contain quarterly wages paid and hours worked during the quarter for each job, which allows for tracking jobs and hourly wages over time. Job Mobility Defined Economists commonly define job mobility as a change of employer, regardless of the reason for the move. Job mobility may occur as a worker pursues career advancement and better wages or as a result of a layoff, quit or firing, which may lead to wage gains or losses depending on the quality of the next job. In the same spirit, we define job mobility as a transition between two employers experienced by a worker during a specific time period where the first event captures a job separation and the second event captures a job hire. This means that our study population includes all workers who experience an employer-to-employer transition regardless of the reason of the initial job separation. New entries into the workforce or exits where individuals don't get a new job within the specified time period don't figure into our analysis population. The study isolates quarterly cohorts of employees who lost jobs and found new jobs within three quarters starting at the quarter of their job loss. Results are summarized over four quarters to give a quarterly average over a calendar year. Two four-quarter periods are considered, each depicting a section of the business cycle. The first one spans third quarter 2008 to second quarter 2009 (covering the period leading to the trough of the Great Recession), while the second one spans third quarter 2012 to second quarter 2013 (covering the recovery period through the most recent UIWR available). Job Quality Defined For the purposes of this study, the quality of a job is measured by the hourly wage it pays. |
1"Middle-Skill Jobs Lost in U.S. Labor Market Polarization," Anton Cheremukhin, Economic Letter, Federal Reserve Bank of Dallas, May 2014.