by Dave Senf
March 2017
Note: All data except for Minnesota’s PMI have been seasonally adjusted. See the feature article in the Minnesota Employment Review, May 2010, for more information on the Minnesota Index.
The Minnesota Index, U.S. Index, and Minnesota Leading Index are generated by the Philadelphia Federal Reserve Bank. At the beginning of each year the indices are delayed by two months as revised component numbers are used to recalibrate the indices. Updated coincident indices are scheduled for release on April 3 while leading indexes will be released April 6.
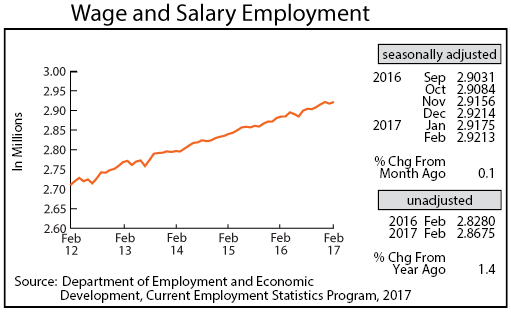
Minnesota’s adjusted Wage and Salary Employment has been flat so far this year after January’s steep decline was revised to a loss of 3,900 jobs and 3,800 jobs were added in February. The private sector added 5,700 jobs which was the highest monthly uptick since April 2004. Construction, spurred by the mild weather, hired 4,500 while Manufacturing added 1,100 jobs. The 4,500 Construction bump was also the largest since April 2004. The Manufacturing job jump was the largest since December 2014.
The biggest job adder was Trade, Transportation, and Utilities with 5,700 new jobs. That is the largest monthly increase since October 1998. Mild weather is probably behind the unusually strong Retail, Transportation, and Utilities hiring just as with the robust Construction hiring. Job losses were steepest in Professional and Business Services, Leisure and Hospitality, and Government.
Minnesota’s unadjusted over-the-year job growth was 1.4 percent in both January and February. Corresponding national numbers were 1.5 and 1.7 percent. Minnesota has now trailed U.S. job growth since August 2014.
Minnesota added 39,700 jobs in 2016 on an annual average basis. Private sector job expansion (34,800) accounted for 87.7 percent of job growth with public sector jobs growth (4,900) accounting for 12.3 percent. Total wage and salary employment in the state in 2016 was 85.4 percent private and 14.6 percent public. Nine of the 11 super sectors added jobs last year. Mining and Logging and Information were the two sectors that saw payrolls decline. Educational and Health Services added the most jobs followed by Trade, Transportation, and Utilities and then Professional and Business Services.
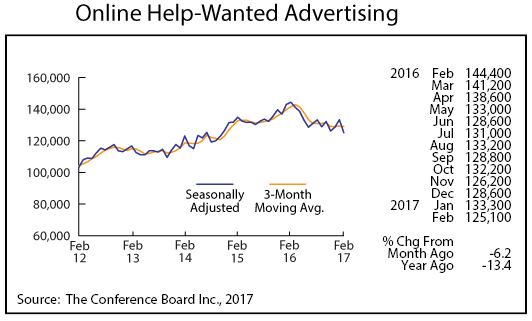
Online Help-Wanted Ads reversed directions in February, falling to their lowest level, 125,100, in over two years. Online job advertising slipped by 6.2 percent in Minnesota and 7.4 percent nationally. Job advertising in Minnesota and nationally has been below last year’s level for about a year now, implying that labor demand is tailing off. Survey-based job openings data, like the national Job Openings and Labor Turnover Survey (JOLTS) and Minnesota’s Job Vacancy Survey, however, are not showing the same decline. The Conference Board, which produces the job posting numbers, announced that they are reviewing their methodology to insure their accuracy and alignment with broader job market trends. Other researchers point out that the recent drop in online job advertising may be related to increasing prices charged by some of the Internet job posting boards. Labor demand is most likely still strong but online help-wanted postings may have slipped in response to higher listing costs.
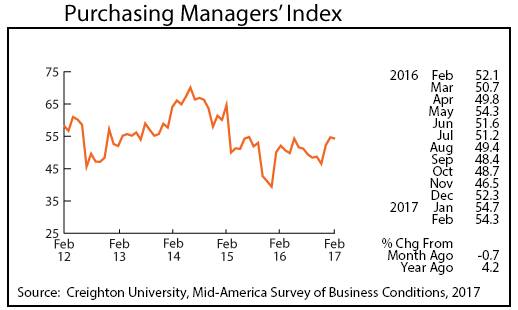
Minnesota’s Purchasing Managers’ Index (PMI), unlike the corresponding national and Mid-American index, inched down in February, falling to 54.3. The national index rose to 57.7, and the Mid-American index climbed to 60.5, its highest level in two years. Minnesota’s Manufacturing sector appears to be gaining some traction but at a rate below manufacturers in other parts of the country.
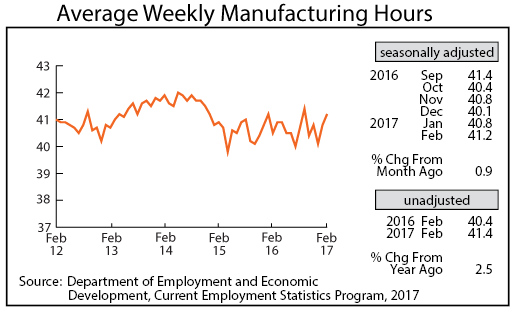
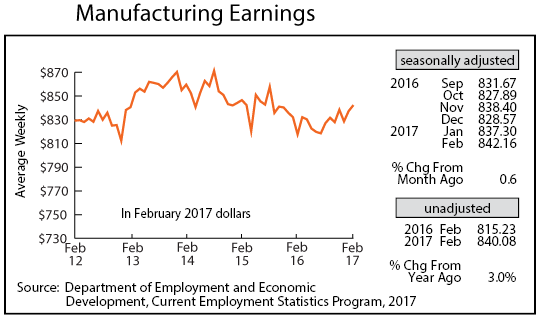
Adjusted Manufacturing Hours increased for the second straight month to 41.2 hours, the highest level since last September. The two-month increase in the factory workweek is consistent with an improving Manufacturing sector in Minnesota. Average weekly Manufacturing Earnings also jumped for the second straight month, climbing to $846.16. That is the highest real factory earnings since August 2015 but still below the average reached three years ago in 2014.
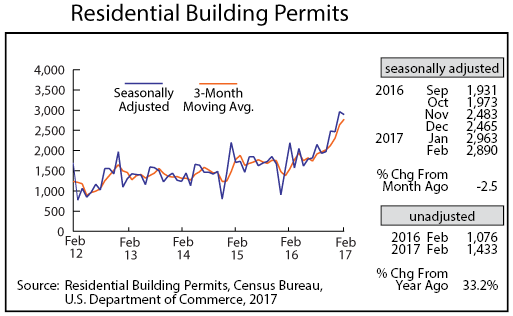
Although adjusted Residential Building Permits dipped slightly to 2,890 in February, home-building permits are off to a roaring start in 2017. It may be the mild weather pushing home building activity up a few months early but, as of now, 2017 is on pace to push activity above the historical norm for the first time in over a decade.
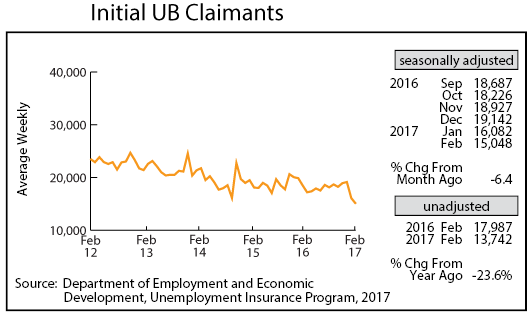
Adjusted Initial Claims for Unemployment Benefits (UB) dropped significantly for the second consecutive month in February, declining to 15,048, the lowest level since May 2000. As the labor market tightens employers seem to be hanging on to employees. The mild winter weather may also be playing a role in low initial claim numbers, but the drop is across almost all sectors of the economy. Initial claims are up from a year ago only in Agriculture, Forestry, Fishing, and Hunting and in Utilities. Claims are down significantly in the other 18 sectors.