by Mark Schultz
February 2022
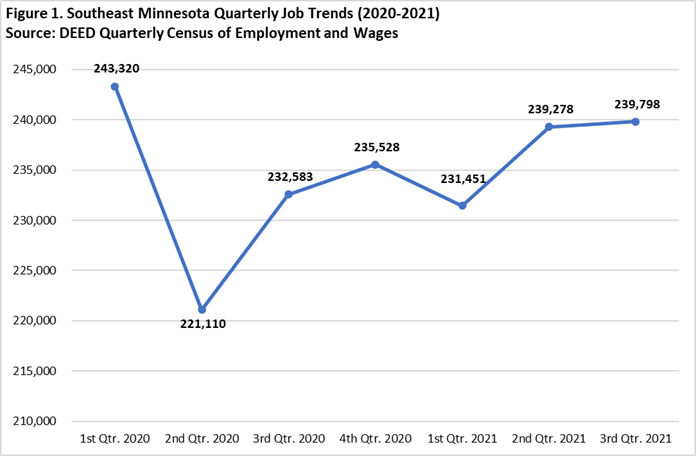
By now the impact of the COVID-19 pandemic has been firmly established, at least as it pertains to the impact it has had on the labor market in Southeast Minnesota. We know that there was an unprecedented loss of jobs at the apex of the pandemic in the second quarter of 2020 and that the region has been recovering since. To recap, from the first to the second quarter of 2020 the region experienced a loss of over 22,200 jobs for a decline of 9.1%. Recent updates to DEED's Quarterly Census of Employment and Wages for the third quarter of 2021 show that the recovery continues, and the region has gained back 84.1% of the jobs lost during the initial shockwave caused by COVID (see Figure 1).
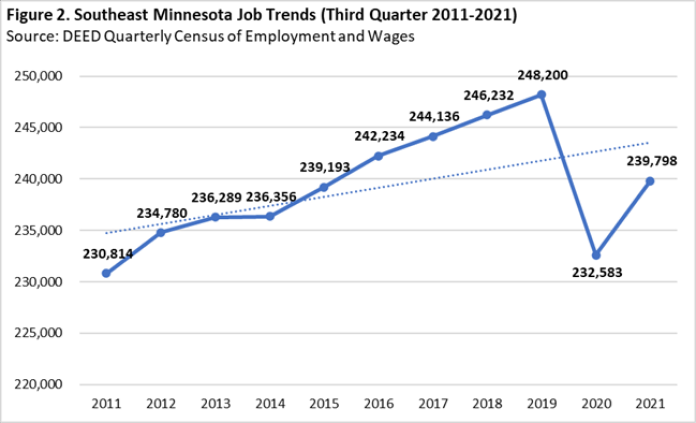
While the number of jobs has not yet reached pre-pandemic levels, the most recent job count for the third quarter of 2021 shows that the number of jobs sits higher than it was 10 years ago. In fact, the current number of jobs rests at just under 9,000 jobs higher than what was seen in the third quarter of 2011, an increase of 3.9%. The data also show that even when the number of jobs bottomed out in the third quarter of 2020 there were still more jobs than were seen in the region in the third quarter of 2011 (see Figure 2).
The largest industry sector in the Southeast region is, not surprisingly, Health Care and Social Assistance with over 66,000 jobs and accounts for one in four jobs in the region. Manufacturing takes the second place trophy with 36,105 jobs, and the bronze medal goes to Retail Trade at 26,156 jobs. Together, these three industry sectors account for over half (53.6%) of the total jobs in the region. Smaller, yet notable, job counts are also seen in Accommodation and Food Services (18,882 jobs), Educational Services (16,932 jobs), Public Administration (11,437 jobs), and Construction (10,640 jobs (see Table 1).
| Table 1. Southeast Minnesota Industry Statistics (Third Quarter 2021) | |||||
|---|---|---|---|---|---|
| Industry Sector | Jobs | Percent of Total Jobs | Firms | Quarterly Payroll | Average Annual Wage |
| Total, All Industries | 239,798 | 100.0% | 12,988 | $3,403,441,408 | $56,732 |
| Health Care and Social Assistance | 66,377 | 27.7% | 1,769 | $1,174,052,587 | $70,720 |
| Manufacturing | 36,105 | 15.1% | 658 | $607,686,848 | $67,288 |
| Retail Trade | 26,156 | 10.9% | 1,606 | $207,745,636 | $31,720 |
| Accommodation and Food Services | 18,882 | 7.9% | 1,112 | $96,950,306 | $20,488 |
| Educational Services | 16,932 | 7.1% | 263 | $227,878,361 | $53,820 |
| Public Administration | 11,473 | 4.8% | 366 | $165,105,344 | $57,512 |
| Construction | 10,640 | 4.4% | 1,476 | $174,052,149 | $65,416 |
| Administrative Support and Waste Mgmt. | 8,400 | 3.5% | 518 | $96,800,161 | $46,072 |
| Transportation and Warehousing | 7,467 | 3.1% | 602 | $95,301,361 | $51,012 |
| Wholesale Trade | 6,506 | 2.7% | 488 | $126,611,752 | $77,792 |
| Other Services (except Public Administration) | 6,266 | 2.6% | 1,328 | $50,806,602 | $32,396 |
| Finance and Insurance | 4,291 | 1.8% | 686 | $76,281,532 | $71,084 |
| Arts, Entertainment, and Recreation | 4,061 | 1.7% | 259 | $27,710,093 | $27,248 |
| Management of Companies and Enterprises | 4,050 | 1.7% | 54 | $99,983,310 | $98,748 |
| Professional, Scientific, and Technical Services | 3,479 | 1.5% | 760 | $49,619,021 | $57,044 |
| Agriculture, Forestry, Fishing, and Hunting | 3,288 | 1.4% | 392 | $32,590,019 | $39,624 |
| Information | 2,515 | 1.0% | 200 | $36,950,598 | $58,760 |
| Real Estate and Rental and Leasing | 1,388 | 0.6% | 383 | $13,428,334 | $38,688 |
| Utilities | 1,296 | 0.5% | 47 | $40,619,471 | $125,320 |
| Mining | 219 | 0.1% | 21 | $3,267,923 | $59,644 |
| Source: DEED Quarterly Census of Employment and Wages | |||||
DEED's data shows that the highest number of employing firms is also in Health Care and Social Assistance with almost 1,800 establishments. However, the second highest number of establishments exists among Retail Trade (1,606), followed by Construction (1,476), Other Services (1,328), and Accommodation and Food Services (1,112). Combined, these five industry sectors account for almost 7,300 firms or 56.1% of the total employing establishments in the region.
It's not too shocking to see that the highest quarterly payroll is seen again in Health Care and Social Assistance, which makes up over one-third (34.5%) of the total quarterly payroll in the region. This is followed by a strong showing in Manufacturing which adds 17.9% to the region's quarterly payroll. The average annual wage across all industries lies at $56,732 per year, but the average annual wages show quite a bit of breadth in the wage spectrum, ranging from $20,488 per year in Accommodation and Food Services (which is 63.9% lower than that seen across all industries) to $125,320 in Utilities (which is 120.9% higher than is seen across all industries). The highest-paying industry sectors in the region, after Utilities, include Management of Companies and Enterprises with an average annual wage of almost $100,000, as well as Wholesale Trade, Finance and Insurance, and Health Care and Social Assistance, each of which pay annual averages over $70,000.
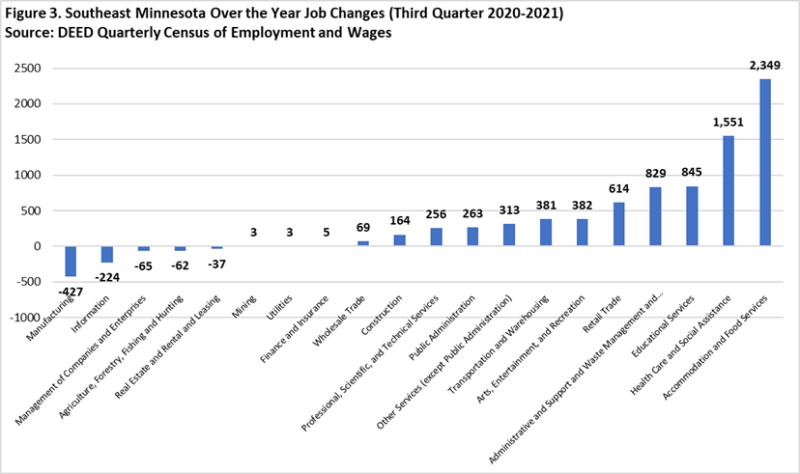
Despite overall job growth from the third quarter of 2020 to the third quarter of 2021 (7,215 jobs), not every industry sector saw an increase, with five sectors losing jobs over the year. The largest loss was seen in Manufacturing, which was down 427 jobs or 1.2%, followed by 224 fewer jobs in Information for a drop of 8.2% which was the highest proportional loss. Other industries that saw job loss include Management of Companies and Enterprises (65 jobs or 1.6%), Agriculture, Forestry, Fishing, and Hunting (62 jobs or 1.9%), and Real Estate and Rental and Leasing (37 jobs or 2.6%). Of the remaining industry sectors that experienced job gains, the largest numeric increases were seen in Accommodation and Food Services, which swelled by almost 2,350 jobs. This sector also had the highest proportional gain at 14.2%. In addition, Health Care and Social Assistance grew by just over 1,150 jobs or 2.4% followed by Educational Services and Administrative Support and Waste Management and Remediation, both of which grew by over 800 jobs (see Figure 3).
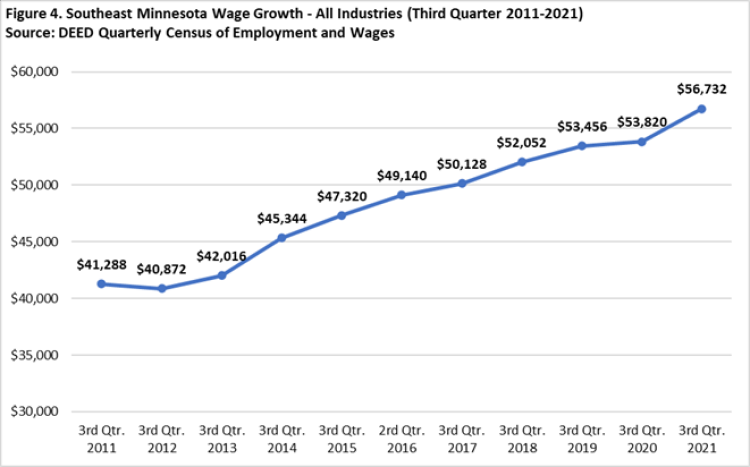
Wage data shows that, for the most part, the average annual wages across all industries have grown over the last 10 years, minus a slight drop ($416 or 1%) from the third quarter of 2011 to the third quarter of 2012. Overall, the average annual wages have increased by over $15,400 over the last 10 years, an increase of 37.4%, after jumping from $41,288 in the third quarter of 2011 to $56,732 in the third quarter of 2021 (see Figure 4).
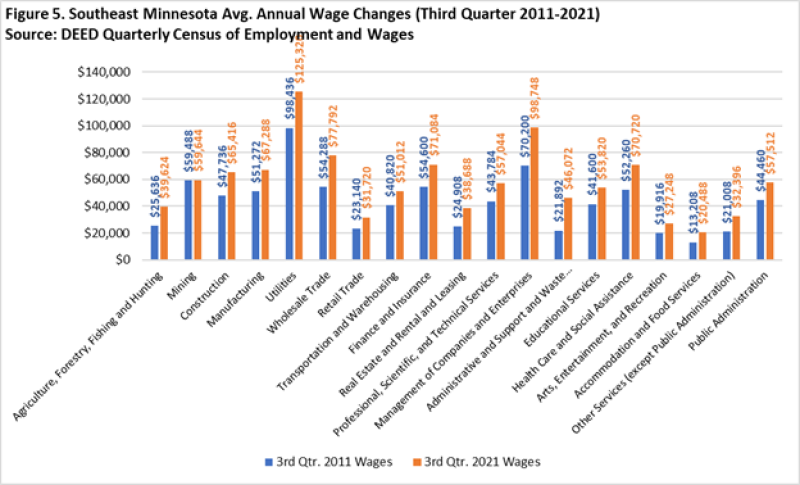
Every industry sector experienced wage growth over the last 10 years to varying degrees. By far the smallest numeric wage growth was seen in Mining, which only increased by $156. However, on the other end of the wage spectrum the largest numeric growth was in Management of Companies and Enterprises, which increased by $28,548 from the third quarter of 2011 to the third quarter of 2021, followed by a bump of $26,884 in Utilities (see Figure 5). Proportionally, Administrative and Support and Waste Management and Remediation experienced the largest increase, more than doubling (110.5%) while four sectors - Real Estate and Rental and Leasing, Accommodation and Food Services, Agriculture, Forestry, Fishing, and Hunting, and Other Services - saw wage growth over 50%.
Over the year the average annual wage across all industries increased by over $2,900 for a jump of 5.4%. The top five largest numeric increases were seen in the following industries: Wholesale Trade ($10,868), Administrative and Support and Waste Management and Remediation Services ($7,956), Manufacturing ($5,824), Health Care and Social Assistance ($3,744) and Utilities ($3,380). Public Administration, on the other hand, saw the lowest numeric increase in wages, growing by only $208. Proportionally, the largest percent increases were seen in Administrative and Support and Waste Management and Remediation Services (20.9%), Wholesale Trade (16.2%), and Accommodation and Food Services (10.7%). Two industry sectors actually saw a decrease in wages, including a drop of $624 in Mining and a decline of $104 in Management of Companies and Enterprises (see Table 2).
| Table 2. Southeast Minnesota Wage Increases (Third Quarter 2020-2021) | ||||
|---|---|---|---|---|
| Industry Sector | 3rd Qtr. 2020 Wages | 3rd Qtr. 2021 Wages | Numeric Change | Percent Change |
| Total, All Industries | $53,820 | $56,732 | $2,912 | 5.4% |
| Agriculture, Forestry, Fishing and Hunting | $36,816 | $39,624 | $2,808 | 7.6% |
| Mining | $60,268 | $59,644 | -$624 | -1.0% |
| Construction | $62,608 | $65,416 | $2,808 | 4.5% |
| Manufacturing | $61,464 | $67,288 | $5,824 | 9.5% |
| Utilities | $121,940 | $125,320 | $3,380 | 2.8% |
| Wholesale Trade | $66,924 | $77,792 | $10,868 | 16.2% |
| Retail Trade | $29,536 | $31,720 | $2,184 | 7.4% |
| Transportation and Warehousing | $49,088 | $51,012 | $1,924 | 3.9% |
| Information | $56,472 | $58,760 | $2,288 | 4.1% |
| Finance and Insurance | $67,964 | $71,084 | $3,120 | 4.6% |
| Real Estate and Rental and Leasing | $37,180 | $38,688 | $1,508 | 4.1% |
| Professional, Scientific, and Technical Services | $54,028 | $57,044 | $3,016 | 5.6% |
| Management of Companies and Enterprises | $98,852 | $98,748 | -$104 | -0.1% |
| Administrative and Support and Waste Management and Remediation Svcs. | $38,116 | $46,072 | $7,956 | 20.9% |
| Educational Services | $53,508 | $53,820 | $312 | 0.6% |
| Health Care and Social Assistance | $66,976 | $70,720 | $3,744 | 5.6% |
| Arts, Entertainment, and Recreation | $25,012 | $27,248 | $2,236 | 8.9% |
| Accommodation and Food Services | $18,512 | $20,488 | $1,976 | 10.7% |
| Other Services (except Public Administration) | $29,640 | $32,396 | $2,756 | 9.3% |
| Public Administration | $57,304 | $57,512 | $208 | 0.4% |
| Source: DEED Quarterly Census of Employment and Wages | ||||
It's promising to see that the Southeast region of the state has rebounded so nicely from the pandemic, gaining back a large chunk of the jobs lost during the initial stages of COVID-19. Despite having a little more ground to make up, the region is on the right track to reach pre-pandemic job levels. To add the cherry on top, wages have continued to increase despite the hit that the region took because of COVID-19.