by Amanda Rohrer
May 2016
Grocery stores are anchors of communities, but also are businesses that are dependent on market forces. As population shifts or larger chain stores begin to pull customers from a surrounding region, the number and dispersal of grocery stores will shift as well. Unfortunately, groceries are not a consumer good that can easily be foregone, so perhaps more than any other type of retail the availability of grocery stores will affect commutes, location decisions, and lifestyle choices.
The discussion of the availability of full grocery stores is often wrapped up with the concept of “food deserts” or areas where residents may not have access to healthy food choices. In Greater Minnesota everything is more disperse than in metros and the discussion has to assume residents have access to a car. However, distances still matter. In most cases this article assumes that a grocery store is available if it’s within 15 miles. Roads weren’t taken into account so some areas may be more isolated, but this mostly limits distances to about 30 minutes by car.
Another feature of this article is that it only uses full grocery stores – NAICS 445110. There may be general stores or convenience stores or farm stands nearer to residents that could meet a fairly large share of their need for groceries, but they are not included in the analysis.
In border counties the nearest grocery stores may be out of state. Minnesota does not have access to individual firm data from the Quarterly Census of Employment and Wages (QCEW) for other states and looking at the state in isolation would suggest that grocery stores in border counties are unusually isolated. The only available alternative is from the Employer Database, information from a private company. Methodology for the two data sources is very different and no time series is available for the private data. Because of those limitations, Employer Database data from neighboring states is used only for mapping purposes and in nearest neighbor calculations. All county and regional aggregates use only the more reliable Minnesota data.
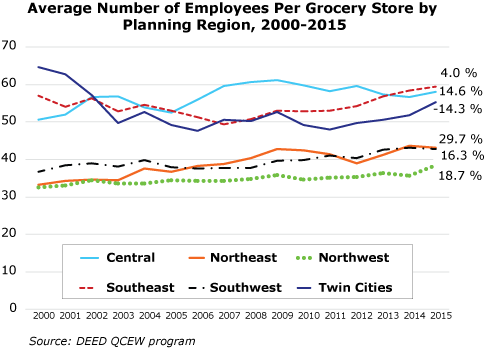
In most parts of the state grocery stores are getting bigger. The average grocery store has more employees than it did in 2000. The exception is in the Twin Cities metro. However, metro grocery stores had 65 Employees on average in 2000 while no other region averaged more than the mid-50s at that time. Twin Cities stores still average higher employment than three regions, and it’s increasing again. The overall decline from 2000 may also reflect the greater prevalence of specialty and ethnic stores in the larger market.
Larger stores require larger customer bases to keep them afloat. Either population growth is primarily in existing population centers and greater density supports larger stores or people are more willing to travel longer distances for groceries – either because their local store closed or because of amenities like product selection or low prices that a large store can offer attract them.
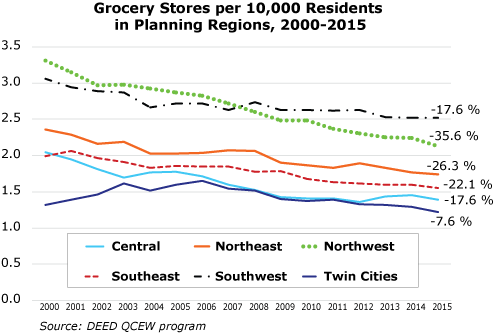
Grocery stores are not just getting larger, there are fewer stores than there were even 15 years ago. Across all planning regions, the number of grocery stores per capita is declining. Again, the Twin Cities region is the outlier. Not only is it the only region where grocery stores per capita peaked mid-decade instead of at the beginning of the series in 2000, but it also has the lowest overall number of stores per capita and the smallest decline in per capita stores (7.6 percent). While the other regions range in their declines from 17.7 percent to 35.6 percent, the Twin Cities’ very low per capita number of stores likely reflects the greater population density of the metro area. The stores are not only larger than in many parts of the state, but they’re also closer to many more people.
The Northwest region is at the opposite extreme – in 2000 there were nearly 3.5 stores per 10,000 people and it has dropped steadily to only about two stores per 10,000. It is no longer the region with the most stores relative to population. For most other regions the pattern was consistent: steady declines through the decade.
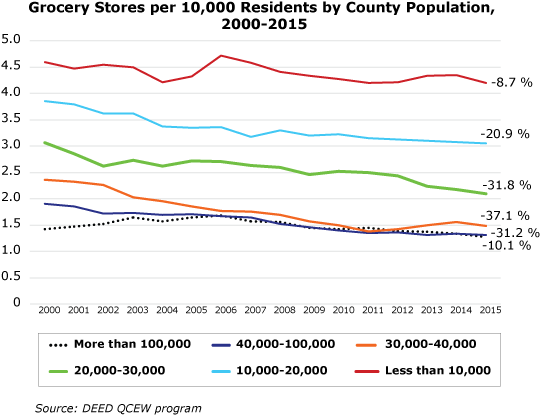
When we group counties by population rather than geographic region we get a slightly different story. The largest counties have the same trend as the Twin Cities Metro counties, probably because there is significant overlap in the two groups. Although the smallest counties are outliers, overall they have much higher per capita stores – from over 4.5 per 10,000 in 2000 to more than 4 per 10,000 in 2015. Interestingly, in this category the decline was lower than any other size, including the largest – only 8.7 percent less than in 2000. In contrast, the mid-sized counties (population 20,000-100,000) all declined in excess of 30 percent in per capita grocery stores since 2000.
It’s interesting that the largest counties all started with different numbers of grocery stores per 10,000 residents but all converged at about 1.5 – the level at which the largest counties have been hovering for most of the decade. This suggests an ideal ratio of population to retail outlets that areas with sufficient density move to rather than unchecked consolidation to larger and larger destination outlets. If the ratio goes above this it becomes difficult for stores to profit, and if it goes lower more stores will step in to poach customers. In metros the trade-off is between the cost of space, the lower prices borne of competition, and the intangibles like services offered or product selection. In smaller counties stores can’t rely on economies of scale to keep prices low and may not need to distinguish themselves by offering extra services. Instead they have to win customers by being nearby as customers make more decisions trading the cost of gas and time of travel against the possibly higher prices in smaller stores. The fact that smaller counties have much higher ratios further supports this notion – people will travel farther for a larger store, but only up to a point. While consolidation is occurring, it seems to happen faster in moderately dense areas where people may have options about where they shop. Although they serve smaller numbers of people in truly isolated communities, grocery stores exist and are continuing to exist.
When a grocery store is isolated and has no nearby competitors it means the residents in the region are similarly isolated from alternative stores. Should something happen to their only accessible store – the owner retires or passes away or the business folds, for example – the customers are left without the amenity. Competition in the market serves a useful purpose. Even beyond the theoretical free market benefits of lower prices or a broader selection, multiple providers of goods and services in an area contribute security and continuity for the people in the area.
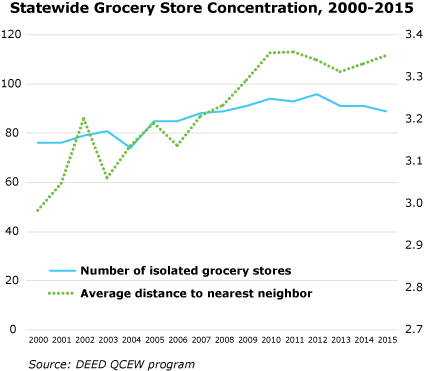
For large swathes of Minnesota, however, that security doesn’t exist in grocery stores. There are simply too few people to support more than one grocery store. These single-source food supply areas are prevalent, particularly in the northern half of the state. Statewide the average distance to the next nearest store was only three miles in 2000, but in 2015 that had increased to 3.3 miles. The number of stores that aren’t within 10 miles of another increased from 76 to 89.
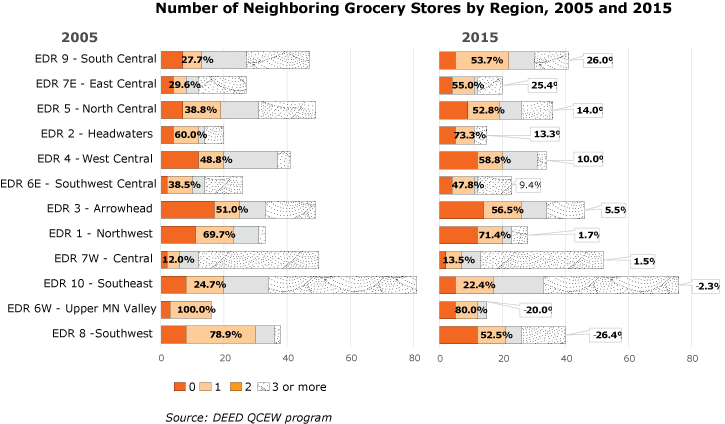
In some regions grocery stores are becoming more isolated at a faster pace. In the chart above (Number of Neighboring Grocery Stores by Region, 2005 and 2015), the percentage on the orange bar indicates the share of grocery stores that are already single sources and have no neighbors within 10 miles or that are teetering on the precipice and have only one neighbor within 10 miles. The callout boxes on the 2015 chart indicate the change in that share between 2005 and 2015. The Twin Cities is excluded from the chart because all of its grocery stores have three or more neighbors, but of the displayed regions nine saw an increase in the number of grocery stores that are the single source or are part of a dual source for some of their customers. Of the other three regions EDR 10 was nearly stable, EDR 6W is very small and a large percentage change is not very substantial numerically, and only EDR 8 has seen any meaningful increase in the diversity of residents’ grocery options. However, while the three or more category has increased, so has the number of single-source stores, while the number of dual-source stores declined. Some areas are seeing improvements while others are definitely not.
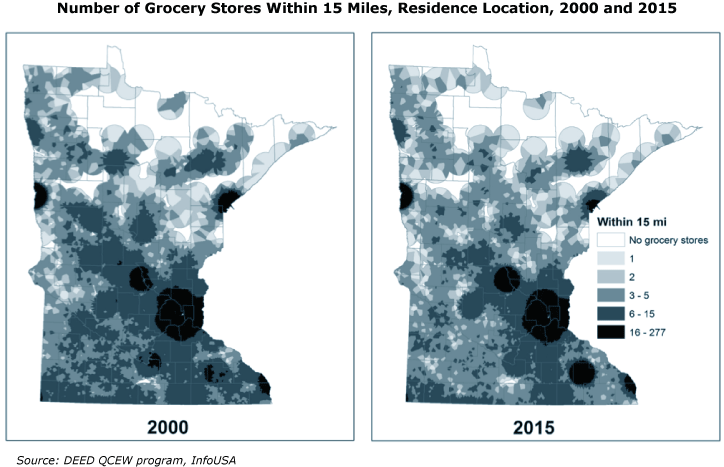
In the maps above (Number of Grocery Stores within 15 miles, residence location 2000 and 2015) these changes are visible. In both 2000 and 2015 population centers have a plethora of options. Rochester and St. Cloud have seen growth in the area that can access a real abundance of stores. Duluth and Mankato have seen declines in the size of the area that’s within reach of the 16 or more stores, but their entire areas can still access six or more stores.
The Western half of the state is notably lighter in 2015 than in 2000. Where there were 6-15 stores available in 2000, there are now only three to five. Where there were three to five, there are now only one or two.
Although stories of communities that lose their grocery store and suffer accordingly attract attention, in most places the process is more gradual and less dire. Grocery stores are very much distributed in the state according to population. Although some land area is without accessible markets, all of that territory is sparsely populated.
More common is the consolidation of stores - communities with two local markets may be seeing the closure of one or people may have to travel one town further to get to a store, but still within a near distance. The effect that pattern has on a community may be much greater than the statistics suggest – in real life, one store can mean a lot more than it does as a single data point.