by Dave Senf
April 2014
Note: All data except for Minnesota's PMI have been seasonally adjusted. See the feature article in the Minnesota Employment Review, May 2010, for more information on the Minnesota Index.
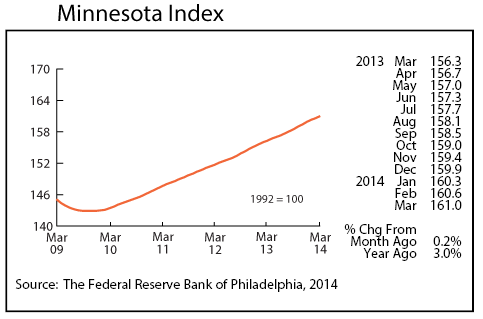
The Minnesota Index advanced 0.2 percent for the second month in a row in March, fueled by higher wage and salary employment and increasing wage and salary disbursements. The index's advance was slowed by a dip in average weekly manufacturing hours and an unemployment rate unchanged from February. Even though the unemployment rate remained at 4.8 percent in March there were promising labor force developments. The state's labor force participation rate has surged sharply over the last few months boosting Minnesota's seasonally adjusted labor force to over 3 million workers for the first time ever in the month of March. Employment, as measured by the household survey, increased by more than 1 percent over the year for the first time in two years in February and March. Workers who have stayed on the sidelines over the last few years seem to be returning to the labor force.
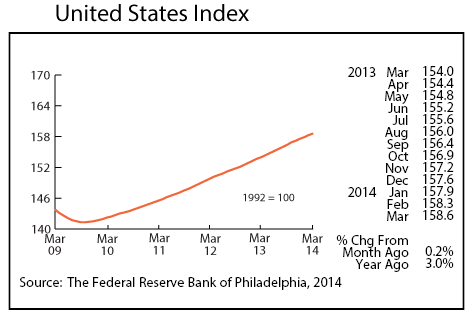
Minnesota's index was up 3.0 percent over the year as was the U.S. index. Minnesota's economy is on track to grow by more than 3 percent for the third year in a row based on the Minnesota Index's current path. The state's GDP last grew by more than 3 percent three years in a row in 1998-2000. Annual average growth during those boom years was 5.5 percent.
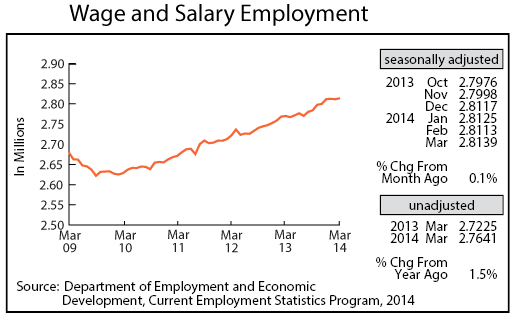
Minnesota's adjusted Wage and Salary Employment picked up in March with 2,600 jobs added. The Private Sector added 1,600 jobs after having cut 1,400 jobs last month. Goods-producing sectors added 3,000 jobs with Construction accounting for 2,700 of them. The jump in construction jobs was the highest in two years. Job growth was also strong in Professional and Business Services, Financial Activities, and Government. Job cutbacks were highest in Leisure and Hospitality, in Trade, Transportation and Utilities, and in Educational and Health Services.
Job growth over the year slipped another notch to 1.5 percent, slightly behind the national 1.6 percent rate. Job growth in Minnesota and nationally is still expected to accelerate over the next few months.
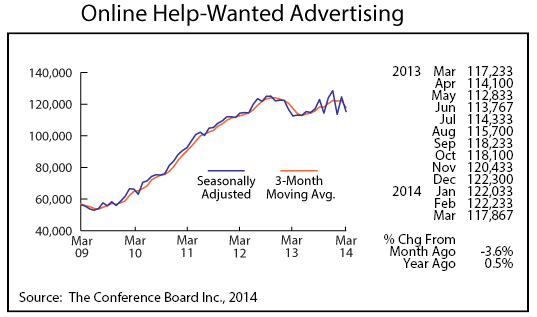
Minnesota's adjusted online Help-Wanted Ads zigzagged down in March, dropping 7.4 percent. U.S. help-wanted online advertising fell 5.6 percent. Help-wanted ads in the state have been zigzagging around 120,000 for the last six months. Minnesota's percent of national help-wanted advertising continues to run around 2.3 percent compared to the state's 2.0 percent of national wage and salary employment.
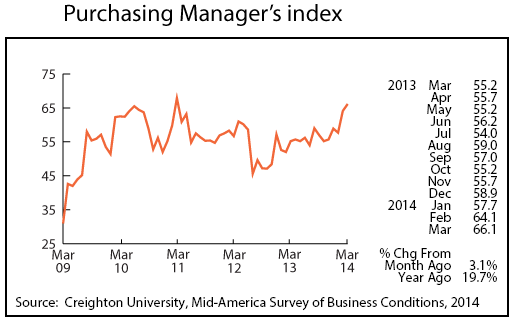
Minnesota's Purchasing Managers' Index (PMI) climbed sharply for the second month in a row, reaching its highest reading since April 2011. The 66.2 reading in March suggests that Minnesota's manufacturing activity will accelerate during the first half of the year. The 54.7 employment component value also points to more hiring in the manufacturing sector. Annual manufacturing job growth waned to 0.7 percent last year after recording 1.7 percent in 2012 and 2.7 percent in 2011.
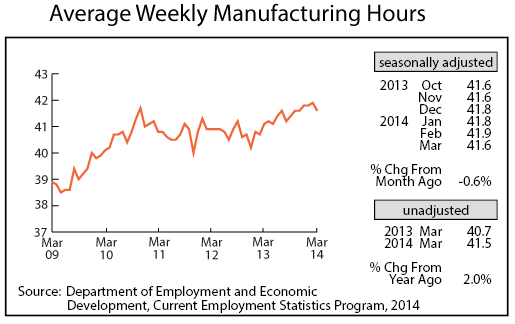
Adjusted Manufacturing Hours tailed off in March, sliding to 41.6 hours from February's unusually high 41.9 hours. Minnesota's factory workweek remains high by historical standards and consistent with the call for increased manufacturing hiring during the next few months.
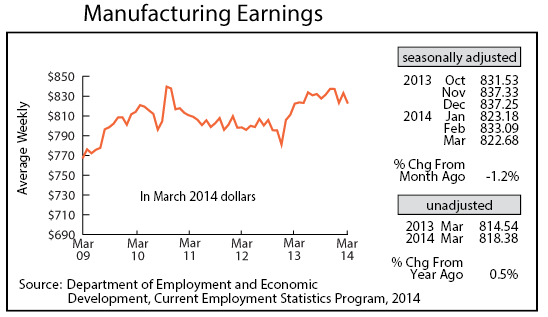
Manufacturing Earnings also tailed off, dropping to $822.68, the smallest paycheck in a year.
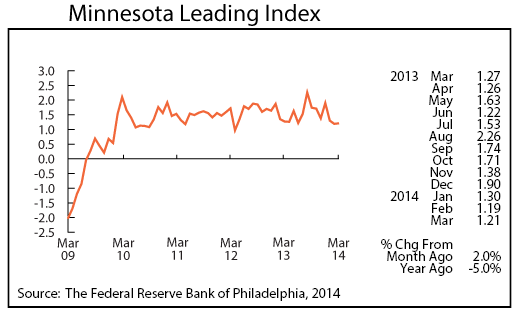
The Minnesota Leading Index inched up but remains noticeably lower than last year's readings. The index may again be sending off false warnings of an approaching slowdown. The index has continuously been revised upward when job numbers are later revised upward. None of the other indicators is pointing toward slower growth over the next few months.
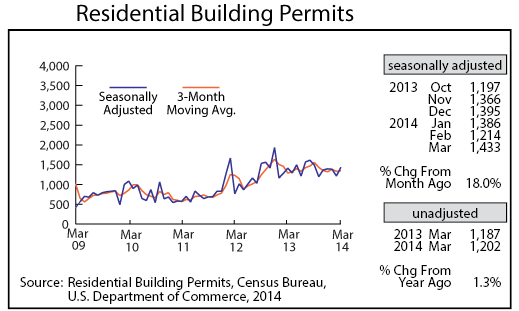
Adjusted Residential Building Permits bounced back in March, jumping to 1,433, the top monthly total since last September. There have been numerous stories lately that the national housing recovery has lost some momentum. March's building permit jump in Minnesota is a hopeful sign that the housing rebound is back on track in Minnesota. Home prices are rising at their fastest pace in over nine years in most of the Twin Cities area.
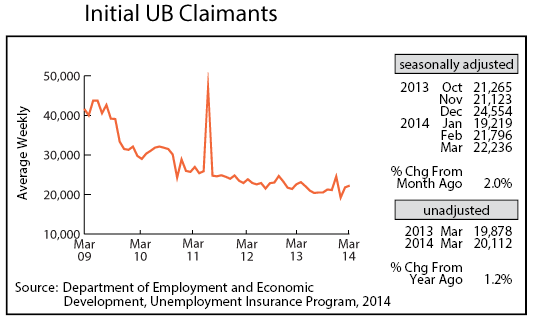
Adjusted Initial Claims for Unemployment Benefits (UB) increased for the second consecutive month in March, inching up 2.0 percent. The current initial claims level remains consistent with job growth ranging between 1.5-1.8 percent on a year-over-year basis during the next few months. The acceleration in Minnesota's labor force growth is a very positive sign that Minnesota's economy may be ready to switch into a higher gear.
