by Tim O'Neill
August 2020
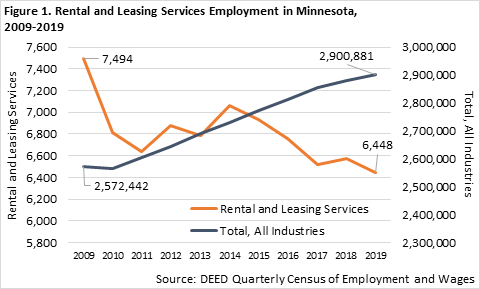
According to the North American Industry Classification System (NAICS), Rental and Leasing Services include those establishments that provide a wide variety of products to customers in return for a periodic rental or lease payment. These products vary from automobiles to industrial machinery to computers and more. As of annual 2019 Minnesota had 749 Rental and Leasing establishments supplying over 6,400 covered jobs. The average annual wage for jobs in this industry, $58,812, was similar to the average annual wage for jobs across all industries in the state, $59,644 (Table 1).
The Rental and Leasing Services industry sector is further broken down by type of establishment. For example, Automotive Equipment Rental and Leasing includes those establishments that rent out or lease passenger cars and trucks. This is typically done from a retail-like facility with shorter rental periods. Meanwhile Commercial and Industrial Machinery and Equipment Rental and Leasing establishments are generally involved in providing capital or investment-type equipment that clients use in their business operations. As such, these establishments are more likely to cater to specific businesses rather than operate retail-like or storefront facilities. Leases from these establishments are generally longer-term.
| Table 1. Rental and Leasing Services (2019) | ||||
|---|---|---|---|---|
| Industry Title | Number of Jobs | Number of Firms | Total Payroll($1,000s) | Average Annual Wage |
| Total, All Industries | 2,900,881 | 178,094 | $172,989,740 | $59,644 |
| Real Estate and Rental and Leasing (53) | 35,601 | 6,350 | $1,946,243 | $54,704 |
| Rental and Leasing Services (532) | 6,448 | 749 | $376,270 | $58,812 |
| Automotive Equipment Rental and Leasing (5321) | 2,497 | 227 | $129,428 | $51,896 |
| Consumer Goods Rental (5322) | 1,796 | 198 | $94,151 | $54,392 |
| General Rental Centers (5323) | 971 | 167 | $42,892 | $44,252 |
| Commercial and Industrial Machinery and Equipment Rental and Leasing (5324) | 1,183 | 156 | $109,799 | $93,028 |
| Source: DEED Quarterly Census of Employment and Wages | ||||
Employment within Rental and Leasing Services has decreased in recent years. Over the past decade of available annual data, 2009 to 2019, this industry lost over 1,000 jobs and over 250 establishments. Most of this loss can be attributed to trends within the Consumer Goods Rental subsector of Rental and Leasing Services. Between 2009 and 2019 this subsector lost over 1,500 jobs and nearly 300 establishments. During that same period of time, Automotive Equipment Rental and Leasing gained 173 jobs, Commercial and Industrial Machinery and Equipment Rental and Leasing gained 205 jobs, and General Rental Centers grew by 93 jobs, all witnessing more stable employment trends.

In 2019 4,548 Repair and Maintenance establishments supplied 22,493 covered jobs in Minnesota. These jobs were distributed among four industry subsectors: Automotive Repair and Maintenance, Electronic and Precision Equipment Repair and Maintenance, Commercial and Industrial Machinery and Equipment Repair and Maintenance, and Personal and Household Goods Repair and Maintenance. Top-employing occupations in this sector include automotive service technicians and mechanics, cleaners of vehicles and equipment, automotive body and related repairers, industrial machinery mechanics, and supervisors of maintenance and repair workers. The average industry wage for these jobs was $48,048 in 2019, with average wages highest in Electronic and Precision Equipment Repair and Maintenance ($68,276) (Table 1).
| Table 1. Repair and Maintenance (2019) | ||||
|---|---|---|---|---|
| Industry Title | Number of Jobs | Number of Firms | Total Payroll($1,000s) | Average Annual Wage |
| Total, All Industries | 2,900,881 | 178,094 | $172,989,740 | $59,644 |
| Other Services (except Public Administration) (81) | 91,383 | 17,272 | $3,245,462 | $35,516 |
| Repair and Maintenance (811) | 22,493 | 4,548 | $1,081,804 | $48,048 |
| Automotive Repair and Maintenance (8111) | 16,152 | 2,942 | $730,914 | $45,240 |
| Electronic and Precision Equipment Repair and Maintenance (8112) | 1,306 | 286 | $89,073 | $68,276 |
| Commercial and Industrial Machinery and Equipment (except Automotive and Electronic) Repair and Maintenance (8113) | 3,277 | 675 | $199,657 | $60,840 |
| Personal and Household Goods Repair and Maintenance (8114) | 1,757 | 646 | $62,160 | $35,360 |
| Source: DEED Quarterly Census of Employment and Wages | ||||
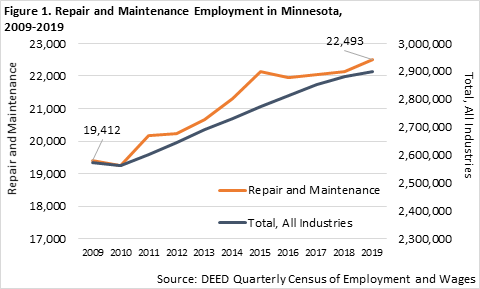
Repair and Maintenance employment witnessed significant shifts surrounding the Great Recession in Minnesota. Between 2002 and 2010 this industry lost over 3,900 jobs, declining by 16.9 percent. Between 2010 and 2019 this industry regained over 3,200 jobs, growing by 16.9 percent (Figure 1). Interestingly, where this industry lost 62 establishments between 2002 and 2010, it added 302 establishments between 2010 and 2019.
Most of the employment losses and gains in Repair and Maintenance are from any employment shifts in Automotive Repair and Maintenance. With 2,942 establishments supplying 16,152 jobs, this subsector accounts for 71.8 percent of total employment within the larger Repair and Maintenance sector (Table 1). Automotive Repair and Maintenance lost 2,888 jobs (-17.0 percent) between 2002 and 2010 before gaining 2,074 jobs (14.7 percent) between 2010 and 2019. Meanwhile, Commercial and Industrial Machinery and Equipment Repair and Maintenance gained 539 jobs between 2010 and 2019 (19.7 percent), and Personal and Household Goods Repair and Maintenance gained 460 jobs (35.5 percent) during that period. Electronic and Precision Equipment Repair and Maintenance lost significant employment between 2000 and 2010 but has remained largely stable over the past decade.

Specific industries found in the Finance and Insurance major industry sector can be a bit tricky to understand at first glance. In this case Securities, Commodity Contracts, and Other Financial Investments and Related Activities includes those establishments that are, according to the North American Industry Classification System (NAICS), engaged in one of the following: underwriting securities issues or making markets for securities and commodities, acting as agents between buyers and sellers of securities and commodities, providing securities and commodity exchange services, or providing services like managing portfolios of assets, investment advice, or trust and fiduciary services. For some further examples, this industry includes bond and stock options dealing, mutual fund agencies, commodity contracts exchanges, and financial planning services.
For a clearer understanding we might look at those occupations that are commonly employed in this industry sector. Such occupations include securities, commodities, and financial services sales agents, personal financial advisors, financial and investment analysts, financial managers, and brokerage clerks. These occupations typically require higher levels of educational attainment and have higher earnings. In fact, the average industry wage for Securities, Commodity Contracts, and Other Financial Investments and Related Activities, $163,488, was nearly three times higher than the average wage for the total of all industries, $59,644.
| Table 1. Securities, Commodity Contracts, and Other Financial Investments and Related Activities (2019) | ||||
|---|---|---|---|---|
| Industry Title | Number of Jobs | Number of Firms | Total Payroll($1,000s) | Average Annual Wage |
| Total, All Industries | 2,900,881 | 178,094 | $172,989,740 | $59,644 |
| Finance and Insurance (52) | 148,582 | 9,544 | $16,007,474 | $107,796 |
| Securities, Commodity Contracts, and Other Financial Investments and Related Activities (523) | 19,872 | 2,348 | $3,245,171 | $163,488 |
| Securities and Commodity Contracts Intermediation and Brokerage (5231) | 11,689 | 812 | $1,914,191 | $163,956 |
| Securities and Commodity Exchanges (5232) | 54 | 18 | $7,288 | $134,680 |
| Other Financial Investments Activities (5239) | 8,129 | 1,518 | $1,323,692 | $163,020 |
| Source: DEED Quarterly Census of Employment and Wages | ||||
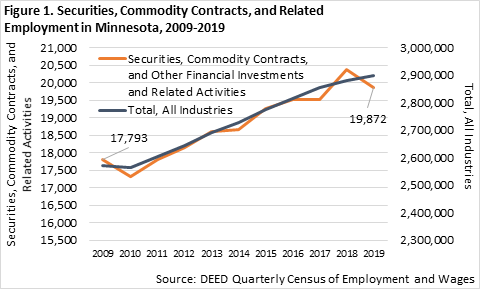
As of annual 2019 the State of Minnesota had 2,348 Securities, Commodity Contracts, and Other Financial Investments and Related Activities establishments supplying 19,872 covered jobs. As such, this industry makes up a smaller share,
Most of the employment in Securities, Commodity Contracts, and Other Financial Investments and Related Activities, 86.2 percent of it, is in the Seven-County Metro Area.

With over 500,000 jobs in 2019, Health Care and Social Assistance is the largest-employing industry sector in the State of Minnesota. This major industry sector is comprised of four in-depth industries including Ambulatory Health Care Services, Hospitals, Nursing and Residential Care Facilities, and Social Assistance. Of these four industries, the composition of Social Assistance likely raises the most questions.
In 2019 7,411 establishments in Social Assistance supplied 101,798 covered jobs in Minnesota. Over two-thirds of these jobs (69,259 jobs) were in Individual and Family Services, which includes Adoption Agencies, Youth Centers, Disability Support Groups, Adult Day Care Centers, and Marriage Counseling Services, among other services. The remaining third of jobs within Social Assistance were within Child Day Care Services (17,146 jobs), Vocational Rehabilitation Services (11,953 jobs), and Community Food and Housing and Emergency and Other Relief Services (3,439 jobs). The average annual industry wage for jobs in Social Assistance, $26,468, was less than half the average annual wage for the total of all jobs in the state, $59,644 (Table 1).
| Table 1. Social Assistance (2019) | ||||
|---|---|---|---|---|
| Industry Title | Number of Jobs | Number of Firms | Total Payroll($1,000s) | Average Annual Wage |
| Total, All Industries | 2,900,881 | 178,094 | $172,989,740 | $59,644 |
| Health Care and Social Assistance (62) | 501,295 | 18,286 | $27,117,925 | $54,080 |
| Social Assistance (624) | 101,798 | 7,411 | $2,698,946 | $26,468 |
| Individual and Family Services (6241) | 69,259 | 5,614 | $1,812,754 | $26,156 |
| Community Food and Housing, and Emergency and Other Relief Services (6242) | 3,439 | 259 | $141,246 | $41,028 |
| Vocational Rehabilitation Services (6243) | 11,953 | 309 | $325,078 | $27,196 |
| Child Day Care Services (6244) | 17,146 | 1,229 | $419,869 | $24,440 |
| Source: DEED Quarterly Census of Employment and Wages | ||||
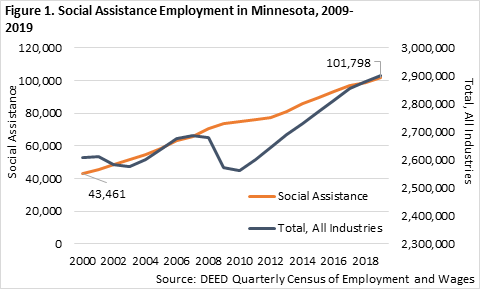
Social Assistance employment in Minnesota has grown very rapidly. Between 2000 and 2019 this industry added an additional 58,337 jobs, growing by 134.2 percent. For reference, the total of all industries grew by 11.2 percent between 2000 and 2019. In other words, Social Assistance grew at a rate 12 times faster than the total of all industries (Figure 1). In 2000 employment in Social Assistance made up approximately 13.9 percent of Health Care and Social Assistance's total employment. As of 2019 it makes up 20.3 percent of Health Care and Social Assistance's total employment.
Individual and Family Services accounted for 84.2 percent of employment growth within Social Assistance between 2000 and 2019. Taking a closer look, Services for the Elderly and Persons with Disabilities added over 40,800 jobs, growing by an incredible 486.9 percent during this period.
