by Dave Senf
March 2013
Note: All data except for Minnesota's PMI have been seasonally adjusted. See the feature article in the Minnesota Employment Review, May 2010, for more information on the Minnesota Index.
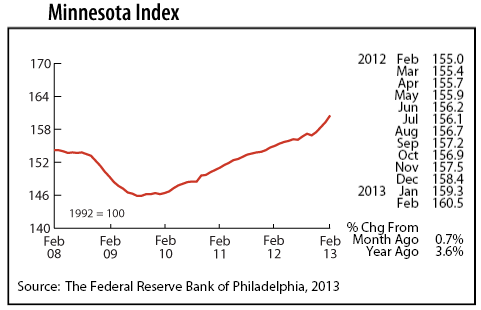
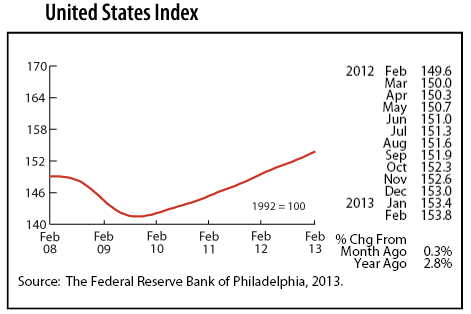
The Minnesota Index soared for the fourth consecutive month, increasing 0.7 percent in February. That's the biggest one month jump since October 2010 and the 13th highest on record dating to 1979. Minnesota's unemployment rate and average manufacturing hours have shown little movement in recent months, but payroll employment is lifting the index into orbit. The index is up 1.9 percent over the last three months. The index hasn't rumbled up this fast over three months since 1983-84 when the state's economy was roaring back from the double-dip recessions of the early 1980s.
The U.S. index increased only 0.3 percent in February. Minnesota's index has raced ahead of the national index in six out of the last seven months indicating that the state's economic growth has picked up speed and is expanding significantly faster than the national economy. Minnesota's economy, as measured by the index, is up 3.6 percent from a year ago while the U.S. economy is up 2.8 percent.
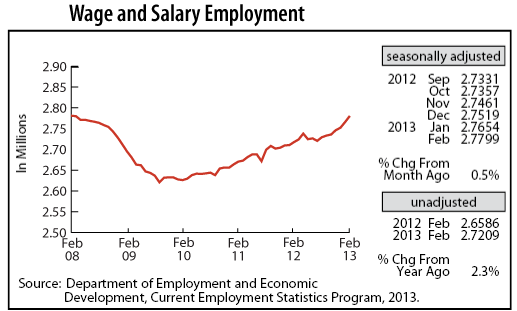
Minnesota's Wage and Salary Employment jumped 0.5 percent for the second straight month in February as 14,500 jobs were added. The pace of hiring in Minnesota has accelerated over the last few months, generating the highest job growth in two decades. The private sector added its highest monthly total since April 2005. Monthly private jobs gains have only topped February's 15,500 twice since 1990 -- in April 2005 and April 2004.
Hiring was strongest in Professional and Business Services, Leisure and Hospitality, Educational and Health Services, and Financial Activities. Payrolls were trimmed in Government, Manufacturing, and Information. Minnesota's over-the-year job growth, based on unadjusted job numbers, spiked to 2.3 percent, the highest over-the-year growth since September 2011. Job growth in the state is outpacing the national rate which was 1.5 percent in February. The 2.3 percent growth for Minnesota translates into 62,400 more jobs in February than a year ago.
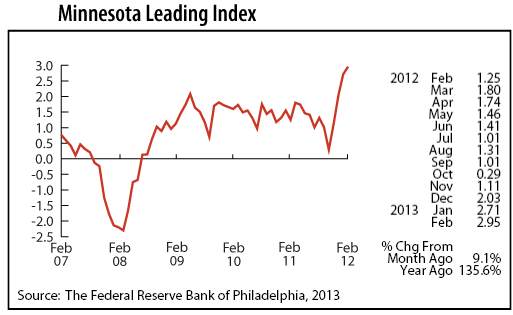
The Minnesota Leading Index continued to explode in February, reaching its highest level since April 1984. The index, which is subject to revisions as employment and income estimates are revised, is pointing toward a Minnesota's economy that will gain strength through the rest of the first half of this year. The uneven recovery of the past three years may be developing into a more robust phase.
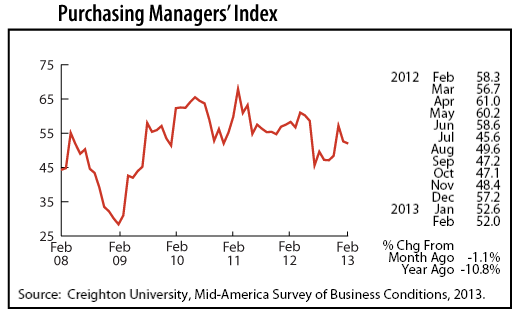
Minnesota's Purchasing Managers' Index (PMI) slipped for the second month in a row, but the decline was mild, and the index remains above growth neutral for the third straight month. The index, from a monthly survey of supply managers in Minnesota carried out by Creighton University researchers, is modeled after the U.S. Institute for Supply Management (ISM) index which measures national manufacturing activity.
Minnesota's index has five components: delivery lead time, employment, inventories, new orders, and production. The employment component topped 50 for the fourth straight month, a good indication that job growth in Minnesota will remain robust through the first six months of 2013.
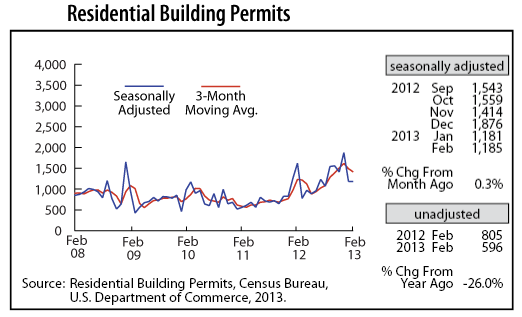
There was no big bounce back in adjusted Residential Building Permits in February from January's big tumble as building permits remained essentially unchanged. Building permits are expected to climb, however, as the housing market continues to show signs of improvement.
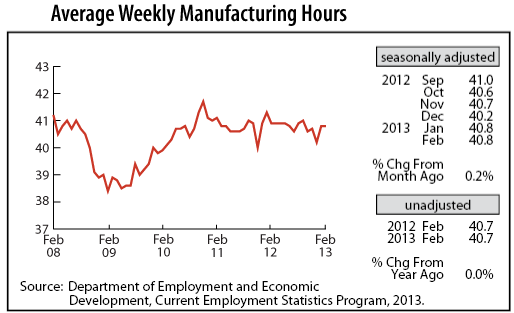
Even though adjusted Manufacturing Hours barely advanced in February, the rebound in factory hours over the last two months is a positive development. The uptick in hours suggests that manufacturing activity in the state is accelerating after having experienced a rough patch in last six months of 2012.
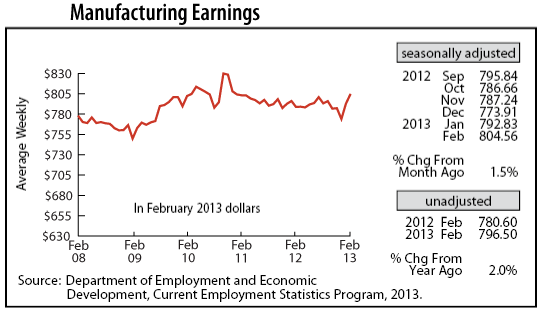
Adjusted Manufacturing Earnings spiked for the second month in a row, reaching $804.56. That is the biggest factory paycheck since December 2010. Real manufacturing earnings were up 2.0 percent from last year.
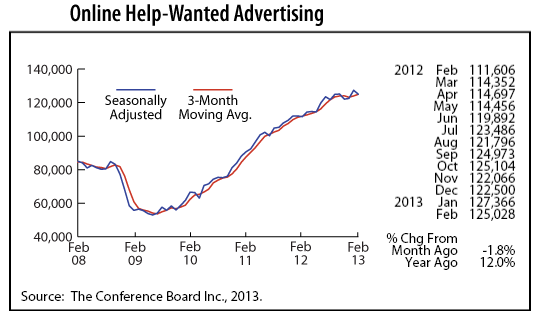
Minnesota's adjusted online Help-Wanted Ads retreated 1.8 percent in February. Online help-wanted ads nationally were also down slightly, dipping 0.9 percent. The state's share of national online help-wanted ads continues to run around 2.5 percent, suggesting that labor demand in Minnesota is stronger than nationally since Minnesota's share of U.S. wage and salary employment is around 2.0 percent.
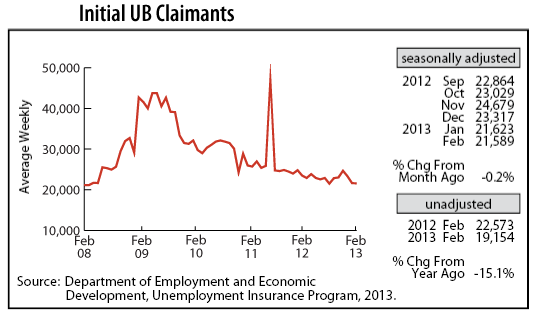
Adjusted Initial Claims for Unemployment Benefits (UB) dipped for the third straight month in February, wiping out the spike in initial claims between September and November of last year. The two-month average initial claims level is the lowest since April 2008. The low level of layoffs points to continued robust job growth in Minnesota in the near term.