by Dave Senf
December 2018
Low levels of discouraged and involuntary part-time workers may signal Minnesota’s new normal.
Signs of Minnesota’s tight job market continue to pile up. The number of unemployed fell below 90,000 in August for the first time since 2000, while the unemployment rate dipped below 3 percent for the first time since 1999.1 The unemployed workers-to-job openings ratio fell to its lowest reading ever (0.6) during the second quarter in 2018. The ratio will likely decline further when the fourth quarter Job Vacancy Survey results are published as labor demand remains solid while the number of unemployed shrinks.2 The number of initial claims for unemployment benefits to total wage and salary employment, a proxy for the rate of layoffs, dipped below 50 initial claims per 10,000 employed for the first time in 48 years in August.3
Is there any slack in the Minnesota labor market that can be tapped to keep job growth hovering around 1.3 percent, as it has over the last three years? Aren’t there lots of potential jobholders who dropped out of the labor force, discouraged by unsuccessful job searches after the recession? Can part-time workers move from the ranks of underemployed into full-time jobs? Fortunately, several broader measures of unemployment address these questions.
The monthly job report highlights the official (U-3) or headline unemployment rate, which is the number of unemployed workers divided by employed and unemployed workers. (Employed and unemployed workers comprise the total labor force.) To be counted as unemployed, a person has to be available to take a job and to have actively sought work in the past four weeks. Other measures of unemployment, or labor underutilization, are called the U-4, U-5, and U-6 unemployment rates.4
The U-4 rate adds discouraged workers. Discouraged workers are defined as persons not in the labor force but who want work and are available to work. These workers have looked for work over the last 12 months but not over the last four weeks because they believe there are no jobs available. U-5, in addition to unemployed and discouraged workers, includes marginally attached workers; these are discouraged workers who have not looked for jobs in the last four weeks, for any reason. The U-6 rate adds employed workers who want to work full time (35 hours per week or more), but due to economic reasons worked only part time (34 hours or less per week). These workers are referred to as involuntary part-time workers – they want to work full time but can’t find a full-time job or their hours have been cut back.
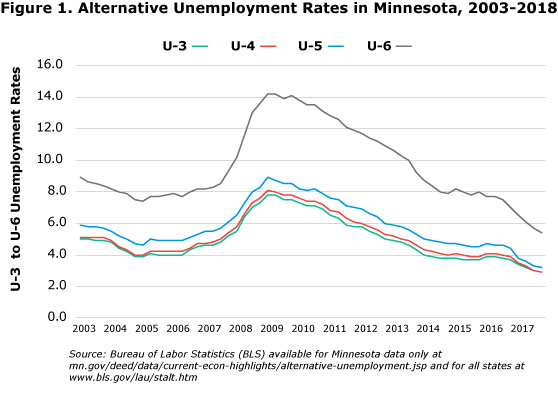
All these measures of Minnesota unemployment, after inching down in 2005 and 2006, started to increase in 2007 and then spiked during the recession (Figure 1). Labor underutilization (as measured by alternative unemployment rates) peaked during the first half of 2009 before declining very slowly over the next nine years. The latest estimates, which are an average between the last quarter of 2017 and the first three quarters of 2018, are the lowest on record. The alternative unemployment rates have only been published at the state level since 2003. Future alternative rates are likely to continue to inch downward over the next six months as labor underutilization dives in the face of the state’s tight labor market.

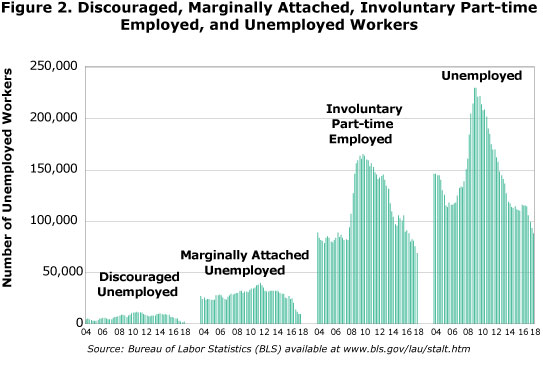
Almost all of the spike in the U-6 rate during the recession came from sharp increases in unemployed and involuntary part-time employed (IVPT) (Figure 2). Labor underutilization, as measured by the U-6 rate, rocketed from 7.8 percent in 2006 to 14.2 percent at the end of 2009. Unemployed workers spiked by 109,000, while IVPT increased by 79,000. The number of unemployed shot up 93 percent while IVPT employment rose 97 percent. During the recession Minnesota employers responded to declining business activity by cutting payroll numbers and reducing their employees’ hours.

The rapid rise in IVPT employment occurred across the nation and generated widespread discussion on whether the increase in IVPT employment was cyclical in nature, caused by weak business conditions leading to lingering weakness in the labor market, or more structural, representing a more permanent use of part-time workers by businesses. A number of reasons supported a permanent increase in the use of involuntary part-time employees: The Affordable Care Act, employee scheduling software that lowered the cost of more part-time staffing, and a shift in employment to service industries, such as restaurants, that required only part-time workers.
As labor markets in Minnesota and across the nation gradually improved over the last nine years, labor market slack waned and IVPT employment returned to pre-recession levels in most states. The latest reading on IVPT employment in Minnesota (October 2017 to September 2018), pegged IVPT at 68,700 workers. That is down almost 20 percent from the average of 83,700 IVPT workers that occurred over the 2004-2007 pre-recession years. Before the recession 3.0 percent of employees in Minnesota wanted to work full-time but for economic reasons were employed only part time. That percent rose to 6.0 percent during the peak of the recession and currently stands at 2.3 percent.
The sharp jump in IVPT employment in Minnesota has proven to have been totally cyclical, as has the increase in discouraged and marginally attached workers in 2009 and 2010. Similar to IVPT employment, the most recent level of discouraged and marginally attached workers has dipped well below the pre-recession level. These are additional indicators of how tight Minnesota’s labor market has become. Low levels of discouraged, marginally attached, and IVPT workers go hand-in-hand with low unemployment rates. We can expect this to be the new normal in Minnesota as long as the national economy remains in expansionary mode.5
1Minnesota Local Area Unemployment Statistics (LAUS)
2Minnesota Job Vacancy Survey (JVS)
3Minnesota Initial Claims for Unemployment Benefits
4Minnesota’s alternative unemployment rates are four-quarter moving averages updated every quarter by the Bureau of Labor Statistics (BLS). The latest rates.