by Dave Senf
November 2019
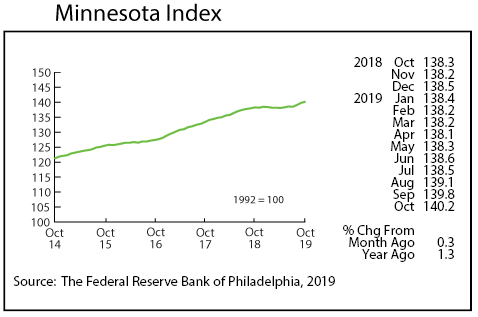
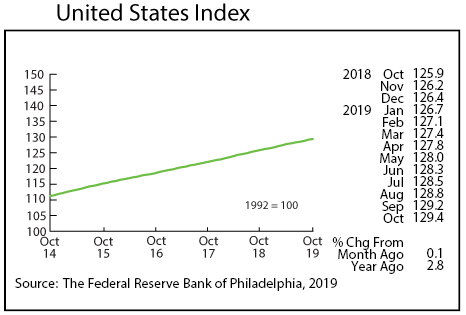
The Minnesota Index climbed for the third straight month, advancing 0.3 percent in October. September’s advance was fueled by increasing average weekly manufacturing hours, higher real wage and salary disbursements, and a jump in wage and salary employment. The unemployment rate remained at 3.2 percent for the second month in a row. The U.S. index increased by 0.1, the lowest monthly gain since last December. Minnesota’s index has increased faster than the U.S. index over the last three months.
October’s reading was 1.3 percent higher than a year ago while the U.S. annual gain was 2.8 percent. Economic growth in Minnesota has accelerated during the last few months while U.S. growth has downshifted. Minnesota’s 0.3 percent increase in October ranked 19th between Oregon and Florida.
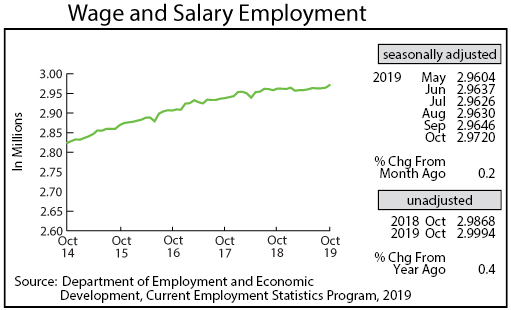
Adjusted Wage and Salary Employment spiked in October, jumping 7,400 jobs, the largest monthly gain in 18 months. Almost all of the uptick in hiring was in the private sector as private sector employment climbed by 7,200 jobs while public sector jobs grew by 200. Leisure and Hospitality along with Trade, Transportation, and Utilities accounted for the bulk of hiring gains. Manufacturers added 1,300 jobs, the highest monthly hiring spree since October 2017.
Private sector job growth was concentrated in Trade, Transportation, and Utilities and in Financial Activities. Gains in those sectors, however, were offset by job loss in Educational and Health Services and Professional and Business Services. Over-the-year job growth for the state, using unadjusted job numbers, increased to 0.4 percent compared to 1.5 percent nationally.
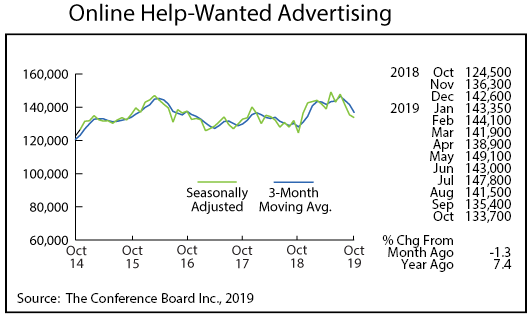
Online Help-Wanted Ads declined for the third month in a row in October, falling 1.3 percent. Online job postings nationally rose 0.2 percent. Minnesota’s share of nationwide online job postings slipped to 2.6 percent in October which is the lowest share since July 2016. Labor demand remains robust in Minnesota as October’s 136,900 online help-wanted ads topped the most recent five-year average of 134,800.
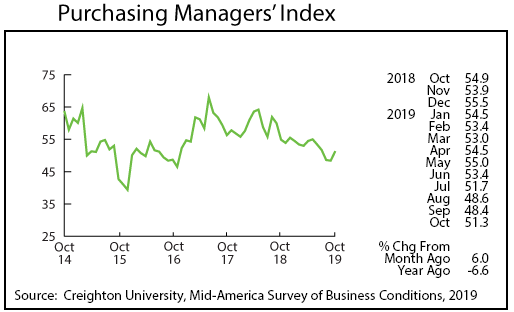
Minnesota’s Purchasing Managers’ Index (PMI), after slipping for four consecutive months, bounced back in October to 51.3. The above 50 reading suggests that manufacturing activity in the state is now increasing after having declined during the previous four months. The other two comparable indices also showed improvement in October with the Mid-America Business Index climbing to 52.6 and the Institute of Supply Management’s national PMI improving to 48.3. Manufacturing in Minnesota and nationally may have stopped deteriorating but a quick rebound to even moderate growth isn’t expected over the next few months.
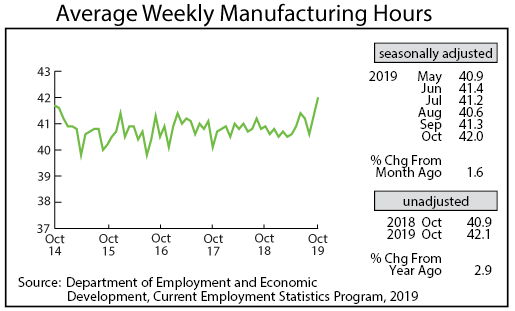
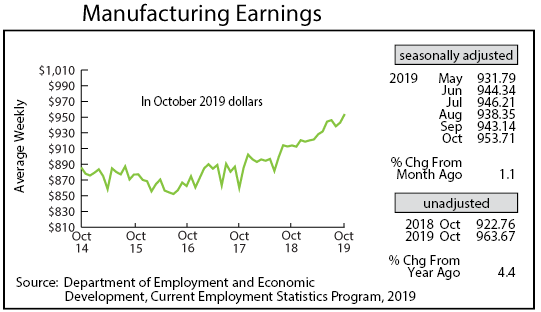
Adjusted average weekly Manufacturing Hours spiked for the second straight month, climbing to 42.0 hours. The factory workweek hasn’t topped 42 hours a week since June 2014. Average weekly Manufacturing Earnings, adjusted for inflation and seasonality, also spiked during the last two months to an all-time high of $953.71 in October. Real manufacturing earnings, adjusted for inflation and seasonally, were up 4.3 percent from last October. Real factory earnings are up 3.9 percent through October compared to 2.3 percent in 2017.
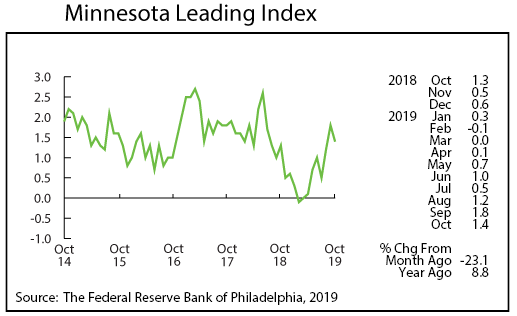
The Minnesota Leading Index retreated slightly in October, dropping to 1.4. The 37-year monthly average is 1.4, so October’s reading suggests that Minnesota’s economic growth over the next six months will match the long-term average. The 1.4 reading indicates that Minnesota’s GDP will expand by 1.4 percent between October 2019 and March 2020. Minnesota’s leading index topped the U.S. leading index for the second straight month. The state’s leading index for October ranked 19th highest among the states, just below Colorado and slightly ahead of South Dakota.
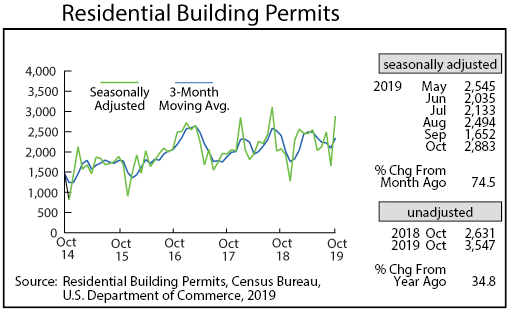
Residential Building Permits skyrocketed in October to 2,883, the second highest monthly level over the last 12 years. Most of the permit activity was for apartment construction. Minnesota home building permits accounted for 2.7 percent of all U.S. home building permits issued in October compared to the 2.1 percent through the first 10 months of the year. October’s robust home-building permit number moves the average monthly level for 2019 3.2 percent ahead of 2018 level through the first 10 months.
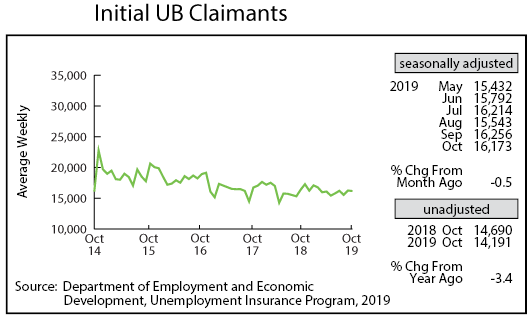
Seasonally Adjusted Initial Claims for Unemployment Benefits (UB) dipped slightly to 16,173 in October. Initial claims remain exceedingly low by historical standards as employers are reluctant to lay off workers given the tightness of the job market. The low layoff rate in Minnesota lends support to the perspective that slow job growth is related to an extremely tight labor market rather than to any drop in demand for workers.
