by Chet Bodin
June 2018
People of color account for 40 percent of the growth in the region’s workforce since 2000.
Looming labor shortage notwithstanding, Northwest Minnesota has been adding workers for years. One of the distinct features of recent labor force growth is the ethnic and racial makeup of new workers. In 2016, the region had 9,000 more people of color in the workforce than in 2000 (see Table 1). This represents 40 percent of the region’s overall labor force growth since the turn of the century, even though people of color accounted for less than 6 percent of the labor force before the demographic shift began.
| Table 1. Employment Characteristics by Race, Northwest Minnesota | ||||||
|---|---|---|---|---|---|---|
| 2016 Labor Force | 2016 Labor Force Participation Rate | 2016 Unemployment Rate | 2000 Labor Force | 2000-2016 Number Change | 2000-2016 Percent Change | |
| Total Labor Force | 286,307 | 64.4% | 4.7% | 261,911 | 24,396 | 9.3% |
| White Alone | 267,880 | 64.5% | 4.0% | 249,469 | 18,411 | 7.4% |
| Black or African American | 2,100 | 61.2% | 12.9% | 600 | 1,500 | 250.0% |
| American Indian and Alaska Native | 9,007 | 60.4% | 20.5% | 6,919 | 2,088 | 30.2% |
| Asian or Other Pacific Islanders | 2,032 | 64.9% | 3.5% | 1,368 | 664 | 48.5% |
| Some Other Race | 1,359 | 73.8% | 10.8% | 1,307 | 52 | 4.0% |
| Two or More Races | 3,895 | 66.0% | 6.9% | 2,248 | 1,647 | 73.3% |
| Hispanic or Latino | 6,722 | 73.9% | 8.5% | 2,983 | 3,739 | 125.3% |
| White Alone, non-Hispanic | 263,175 | 64.3% | 3.9% | 248,001 | 15,174 | 6.1% |
| Source: 2012-2016 American Community Survey, 5-Year Estimates | ||||||
Since 2000, every major racial and ethnic group in the region has added to labor force growth. Three of the five largest racial groups in Northwest Minnesota added over 1,500 workers each, including black or African Americans (up 1,500), American Indian and Alaska natives (up 2,088) and people identifying as two or more races (up 1,647).
In both 2000 and 2016, American Indians and Alaska natives represented the largest minority group in Northwest Minnesota. Their presence in the labor force increased by more than 30 percent during that stretch of time.
Most other racial groups grew at an even faster pace during that period. In 2016, the region's black or African American labor force was estimated to be three and one-half times larger than in 2000. The increase in Asians or other Pacific Islanders and people of two or more races also outpaced that of American Indians, growing at 48.5 and 73.3 percent, respectively.
The Hispanic or Latino population, which is an ethnic category rather than a racial group, added 3,739 workers (more than any other minority group). Most Hispanics identify as white, although approximately 500 of the new Hispanic or Latino labor force participants identified as a minority race. The net increase from 2000 to 2016 in Hispanic or Latino labor force entrants exceeded that of any race by more than 1,000 workers. In total, the number of Hispanic or Latino workers of any race more than doubled. When compared with categories of race, only the black or African American labor force had a higher rate of increase in the region.
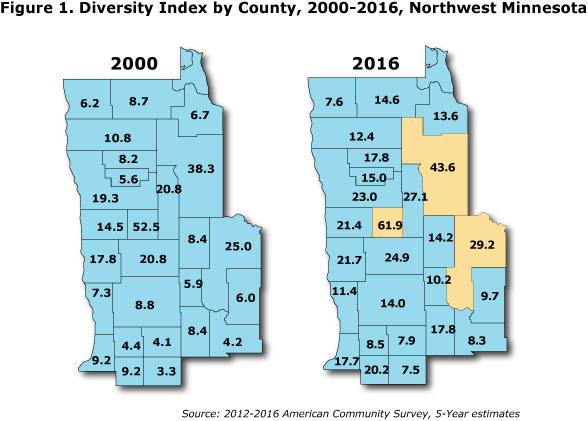
Growth in the minority labor force has been fueled by an overall ethnic and racial diversification of the region's population. Developed for USA Today, the Diversity Index allows researchers to gauge such diversification at the county level, offering a look at the distribution of racial and ethnic growth throughout the region. The Diversity Index uses a scale of 1 to 100 to represent the chance that two people chosen randomly from an area will have different races or ethnicities. A higher number means more diversity, a lower number means less.1
As would be expected, the Diversity Index was highest in counties that are historically home to the region's American Indian population. Mahnomen County (61.9), Beltrami County (43.6) and Cass County (29.2) have the three highest diversity indices in the region and are home to American Indian reservations. With the largest American Indian population in the state, it's no surprise that diversity in Northwest Minnesota is highly associated with these communities (see Figure 1).

But the region's more recent gains are mainly being fueled by emerging communities of color in other counties. Among the top five counties where diversity has increased the most from 2000 to 2016, only Mahnomen has a reservation. The others are Stevens County (up 11.0), Pennington County (up 9.6), Red Lake County (up 9.4) and Todd County (up 9.4).
In the five counties with the largest increases, the Hispanic or Latino population grew by an average of 392 percent, while the black or African American population rose by an average of 248 percent. Simultaneously, these counties lost 401 white residents on average, whose decline contributed to higher diversity scores as well.
Overall, the racial and ethnic mix in Northwest Minnesota increased across the board from 2000 to 2016, with the Diversity Index increasing in every county. The median change in diversity score by county was up 4.75 points, resulting in a total median county score of 14.8 in 2016. In comparison, Minnesota's statewide diversity index was 35.1, which was exceeded by only two of Northwest's 26 counties. Still, the median growth in diversity across the region was 64.7 percent, and the index has doubled in six counties since 2000. Statewide the diversity index grew by 44.6 percent, indicating that the rate of change was often faster in Northwest Minnesota.
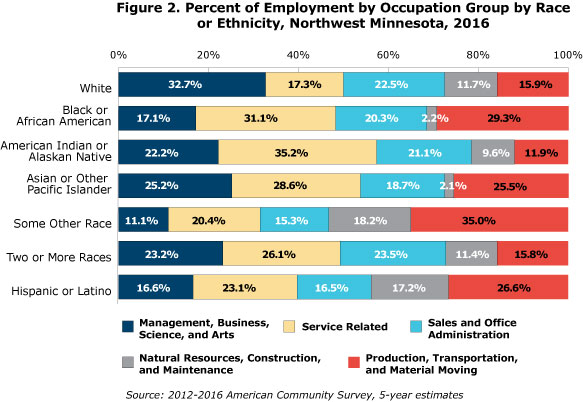
As the population and labor force in Northwest Minnesota continue to diversify, people of color are finding work in a variety of occupations, including fields with a high number of job vacancies. It's clear these new residents bring a variety of skills to the regional workforce. Service-related and production, transportation and material moving occupations stand out. Almost 50 percent of minority workers in Northwest Minnesota had jobs in one of these categories (see Figure 2).

Service-related jobs are the top area of employment for American Indians, blacks, Asians and people of two or more races. These include low-paying food preparation jobs often associated with the service industry, but also jobs in health care support, protective service and personal care, among others.
Production, transportation and material moving occupations are top for the Hispanic or Latino population and those of some other race. Many jobs in the manufacturing sector fall into this category, as do truck drivers and warehouse workers. Nearly 30 percent of blacks or African Americans working in Northwest Minnesota were also employed in these occupations.
With employers posting record numbers of job vacancies in the past four years, new workforce entrants who can fill these jobs hold an important place in the regional economy. According to DEED's Job Vacancy Survey in the fourth quarter of 2017, over 50 percent of job vacancies in Northwest Minnesota were found in the two major occupation groups (service related and production, transportation and material moving) most likely to be held by minority workers (see Table 2).
| Table 2. Northwest Minnesota Job Vacancies by Occupation Group, 2017 Q4 | ||||||
|---|---|---|---|---|---|---|
| Number of Vacancies | Median Hourly Wage | Percent of Total | ||||
| Total | 8,899 | $12.74 | 100.0% | |||
| Management, Business, Science and Arts | 1,964 | $20.81 | 22.1% | |||
| Service Related | 2,929 | $11.16 | 32.9% | |||
| Sales and Office Administration | 1,676 | $11.59 | 18.8% | |||
| Natural Resources, Construction and Maintenance | 665 | $14.51 | 7.5% | |||
| Production, Transportation and Material Moving | 1,654 | $13.31 | 18.6% | |||
| Source: DEED Job Vacancy Survey, 2017 Q4 | ||||||
In addition, on average 19.2 percent of people of color worked in management, business, science and arts, which are positions that often require leadership skills and postsecondary education. Workers in these occupations are highly needed in the region.
People of color are a vital part of the economy in Northwest Minnesota, and the region has plenty of opportunities for others to move there and earn a sustainable living. Many regional job vacancies offer wages that meet or exceed what a single person needs to cover the basic cost of living. Other jobs offer a track toward higher earnings over time for families needing to earn more.
The median hourly wage for all occupations in Northwest Minnesota now stands at $17.38, enough for most individuals and families to make ends meet – and then some. Overall, there has been momentum toward diversification in the region. If more workers decide to follow, there are employers and communities in Northwest Minnesota ready to invest in them.
1Meyer, Philip and Shawn McIntosh (1992): "The USA Today Index of Ethnic Diversity," International Journal of Public Opinion Research. Spring, p. 56.