by Nick Dobbins
April 2019
In February the Current Employment Statistics (CES) program published newly-benchmarked estimates for 2018. The annual benchmarking process allows us to look back on the previous year's estimates and to discuss what has changed since they were originally published.
Benchmarking is the process by which the Bureau of Labor Statistics sets the baseline CES estimates for the previous year, bringing those numbers into line with Unemployment Insurance (UI) data, which are the product of a census of employers. CES values are reset to match UI findings through the third quarter (the newest available data), with the final three months of the year re-estimated from that baseline, and the following year's estimates built from the new foundation.1 Because the national estimation process draws from survey data in every state, and total employment is built from a summary of component series, national estimates are fairly robust, with changes to total nonfarm employment at the national level generally fairly small. Individual supersectors show more change.
Table 1 illustrates the changes made in each major industry group for March of 2018, which is the only month that national data are tied directly to UI data. State and area estimates are benchmarked for each available month individually, since the possibility for error is higher there.
| Table 1. National CES Estimate Revisions for March 2018 Benchmark | |||||
|---|---|---|---|---|---|
| CES Industry Code | CES Industry Title | As Revised | As Previously Published | Differences | |
| Amount | Percent | ||||
| 00-000000 | Total Nonfarm | 148,279 | 148,280 | -1 | <0.05% |
| 05-000000 | Total Private | 125,870 | 125,956 | -86 | -0.1% |
| 06-000000 | Goods-producing | 20,527 | 20,516 | 11 | 0.1% |
| 07-000000 | Service-providing | 127,752 | 127,764 | -12 | <0.05% |
| 08-000000 | Private Service-providing | 105,343 | 105,440 | -97 | -0.1% |
| 10-000000 | Mining and Logging | 714 | 722 | -8 | -1.1% |
| 20-000000 | Construction | 7,201 | 7,164 | 37 | 0.5% |
| 30-000000 | Manufacturing | 12,612 | 12,630 | -18 | -0.1% |
| 31-000000 | Durable Goods | 7,886 | 7,883 | 3 | <0.05% |
| 32-000000 | Nondurable Goods | 4,726 | 4,747 | -21 | -0.4% |
| 40-000000 | Trade, Transportation, and Utilities | 27,591 | 27,736 | -145 | -0.5% |
| 41-420000 | Wholesale Trade | 5,834.80 | 5,962 | -127.2 | -2.2% |
| 42-000000 | Retail Trade | 15,834.30 | 15,930.40 | -96.1 | -0.6% |
| 43-000000 | Transportation and Warehousing | 5,365.60 | 5,289 | 76.6 | 1.4% |
| 44-220000 | Utilities | 555.8 | 554.1 | 1.7 | 0.3% |
| 50-000000 | Information | 2,824 | 2,765 | 59 | 2.1% |
| 55-000000 | Financial Activities | 8,537 | 8,548 | -11 | -0.1% |
| 60-000000 | Professional and Business Services | 20,816 | 20,817 | -1 | <0.05% |
| 65-000000 | Educational and Health Services | 23,518 | 23,491 | 27 | 0.1% |
| 70-000000 | Leisure and Hospitality | 16,244 | 16,248 | -4 | <0.05% |
| 80-000000 | Other Services | 5,813 | 5,835 | -22 | -0.4% |
| 90-000000 | Government | 22,409 | 22,324 | 85 | 0.4% |
| Source: Bureau of Labor Statistics, Current Employment Statistics program | |||||
The revisions to total nonfarm estimates at the state level are somewhat more dramatic. The average 2018 estimate dropped by roughly 10,000 jobs, going from 2,964,000 to 2,954,400 (0.32 percent). When we look at the revisions on a monthly basis, we can see that they tend to grow over time, as we get further from the prior years' benchmarked data. October of 2017's re-estimate was only off its benchmark level by 2,160 (0.07 percent), but by the time we reach the December 2018 re-estimate, the difference is 16,121 (0.54 percent).
Minnesota was one of 39 states, plus the District of Columbia, with downward revisions in the final benchmark month (December 2018), while 11 states had upward revisions.2 Table 2 shows the original and revised estimates in Minnesota for each month since October 2017.
| Table 2. Monthly Total Nonfarm Employment Revisions for Minnesota, 2018 Benchmark | ||||
|---|---|---|---|---|
| Year-Month | Revised Total Nonfarm Estimate | Originally Published Estimate | Difference | Percent Difference |
| 17-Oct | 2,964,272 | 2,966,432 | -2,160 | -0.07% |
| 17-Nov | 2,960,355 | 2,956,716 | 3,639 | 0.12% |
| 17-Dec | 2,946,667 | 2,941,511 | 5,156 | 0.17% |
| 18-Jan | 2,898,971 | 2,889,093 | 9,878 | 0.34% |
| 18-Feb | 2,904,971 | 2,896,993 | 7,978 | 0.27% |
| 18-Mar | 2,900,793 | 2,901,905 | -1,112 | -0.04% |
| 18-Apr | 2,924,727 | 2,922,115 | 2,612 | 0.09% |
| 18-May | 2,972,453 | 2,972,749 | -296 | -0.01% |
| 18-Jun | 2,996,934 | 3,018,542 | -21,608 | -0.72% |
| 18-Jul | 2,980,780 | 3,006,834 | -26,054 | -0.87% |
| 18-Aug | 2,980,579 | 3,002,119 | -21,540 | -0.72% |
| 18-Sep | 2,972,874 | 2,992,061 | -19,187 | -0.64% |
| 18-Oct | 2,986,820 | 3,003,363 | -16,543 | -0.55% |
| 18-Nov | 2,975,627 | 2,989,993 | -14,366 | -0.48% |
| 18-Dec | 2,956,831 | 2,972,952 | -16,121 | -0.54% |
| Source: Bureau of Labor Statistics, Current Employment Statistics State and Area Estimates | ||||
As part of the 2018 benchmark activities, a large-scale Quarterly Census of Employment and Wages (QCEW) recoding event moved a significant amount of employment out of CES Series 41-425120, Wholesale Trade Agents and Brokers (NAICS 425120 in QCEW). Nationally, the change amounted to 336,000 jobs being moved out of the industry group, with many series being revised well beyond the normal benchmark timeframe, many of them all the way back to their original estimate.
In Minnesota the closest published CES series affected was 41-425000, Wholesale Electronic Markets and Agents and Brokers. More than half of the jobs in that industry were moved elsewhere in the revision, and changes were made all the way back to the series' origin in 1990. 2017's average job count was revised from 21,207 to 8,511, a change of 60 percent. The 1990 series was revised from 26,850 to 13,573 (49 percent).
The spillover from this change, in combination with some other less dramatic revisions, led to changes across a wide array of industry groups. In all, five Minnesota supersectors were revised back to their origin in 1990 (Manufacturing, Trade, Transportation, and Utilities, Financial Activities, Professional and Business Services, and Educational and Health Services), and many other series were revised past the usual benchmarking window. The broadest-level summary series to be revised all the way back to 1990 were Goods-Producing and Service-Providing. Service providers lost a small amount of employment, which was moved to goods producers.
The completion of the 2018 benchmark also allows us the opportunity to look back at our first year of concurrent seasonal adjustment. Starting in January of 2018, the CES program began producing state seasonally adjusted estimates on a concurrent basis, recalculating each month to include all available data. This was a change from the previous method, which involved finding seasonal factors for the entire year at the outset, using only the available data from the previous year.
The move aims to improve both accuracy and smoothness of adjusted data, and extensive research demonstrated that it does precisely that3. There is room for some noise at the state level, however, and the situation bears watching.
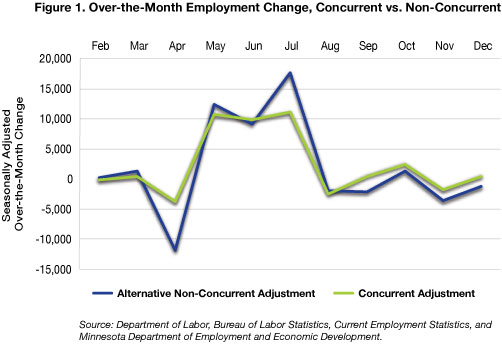
In the first year of implementation, concurrent adjustment appeared to improve smoothness of estimates, at least at the total nonfarm level, as is illustrated in Figure 1.

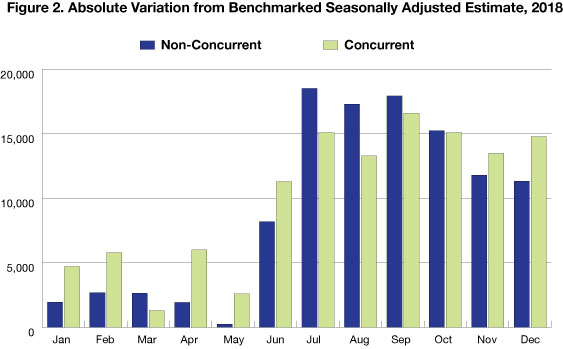
As Figure 2 shows, however. overall accuracy is a mixed-bag on a month-by-month basis. This is largely to be expected, as the total difference in accuracy between the two adjustment methods has been shown to be quite small. In over 90 percent of tested series, overall gain or loss from concurrent adjustment was less than 0.1 percent3.

1United States Department of Labor, Bureau of Labor Statistics, Technical Notes for the Current Employment Survey.
2Bureau of Labor Statistics' Current Employment Survey, 2018 State and Area Benchmark Article.
3Mance,S. Concurrent Seasonal Adjustment of State and Metro Payroll Employment Series October 2015.