by Dave Senf
October 2018
Note: All data except for Minnesota’s PMI have been seasonally adjusted. See the feature article in the Minnesota Employment Review, May 2010, for more information on the Minnesota Index.
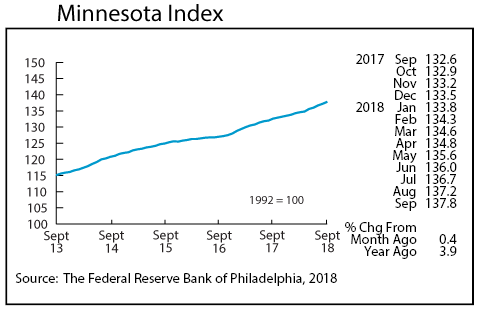
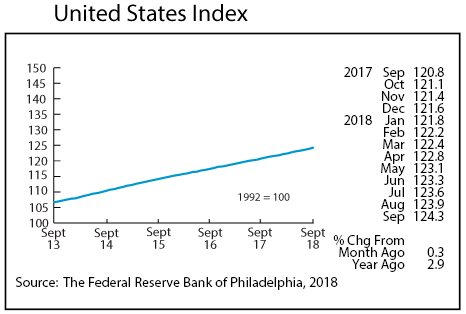
The Minnesota Index continued to rumble along at a robust pace, advancing 0.4 percent in September. Three of the four components of the index moved positively in September with unemployment inching down again, manufacturing hours inching up, and real wage and salary disbursements increasing. The small drop in wage and salary employment was not enough to keep the index from rolling on.
The 0.4 gain by the index ranked Minnesota ninth among states, right in front of California and right behind Washington. It was the fifth month in a row that Minnesota’s index increased faster than the U.S. index which advance 0.3 percent in September. Minnesota’s index has increased 3.9 percent since last September compared to 2.9 percent for the U.S. index over the same period. Minnesota’s over-the-year increase ranked 13th between Oregon and Illinois.
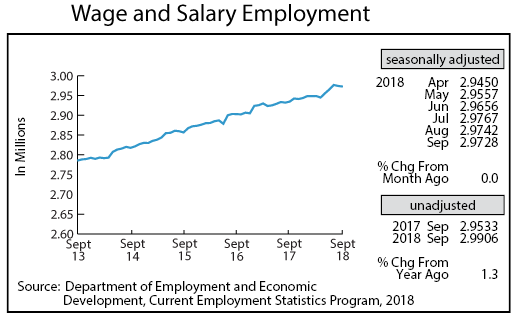
Minnesota’s adjusted Wage and Salary Employment decreased slightly for the second straight month, declining by 1,400 jobs in September. Revised data for August show a loss of 2,500 in that month. After adding 31,700 jobs from May through July on a seasonally adjusted basis, 3,900 jobs have been cut since August. Wage and salary employment in the state has expanded by 29,100 since December 2017 or roughly 1.0 percent.
Private employers cut 2,500 jobs in September while the public sector added 1,100 positions. Job reduction was highest in Leisure and Hospitality, Manufacturing, and Other Services. Job expansion was strongest in Government, Trade, Transportation, and Utilities, and Financial Activities.
Minnesota’s unadjusted over-the-year job growth fell again in September to 1.3 percent, its lowest level since May. U.S. over-the-year job growth was 1.9 percent over the last 12 months.
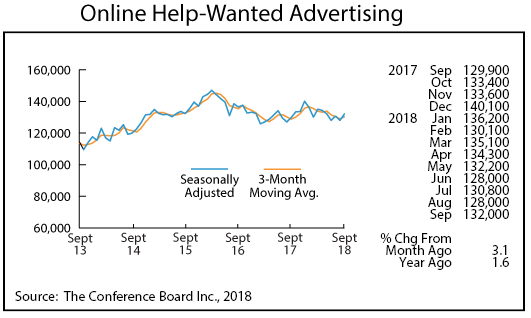
Online Help-Wanted Ads rose 3.1 percent in September to 132,000. Job postings nationally increased 3.2 percent. Minnesota’s share of online help-wanted ads continues to hover at 2.8 percent compared to the state’s 2.0 percent share of national wage and salary employment. Twelve states now have a supply (unemployed workers) to demand (online help-wanted ads) ratio below 1. Minnesota’s ratio was second lowest at 0.66 next to North Dakota’s 0.63 rate. All of Minnesota’s neighboring states have supply/demand ratio below 1.0 indicating that employers across the Upper Midwest are having a hard time finding workers to fill their job openings.
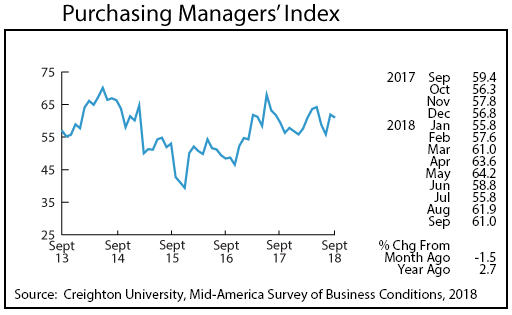
Minnesota’s Purchasing Managers’ Index (PMI) inched down in September to 61.0 but remained safely above growth neutral (50) and continues to point to healthy economic growth through the rest of the year. The comparable national index also retreated in September to 59.8 as did the Mid-America Economic Index which retreated to 57.5. The Mid-America Index includes Minnesota and eight other states stretching from Arkansas to Minnesota.
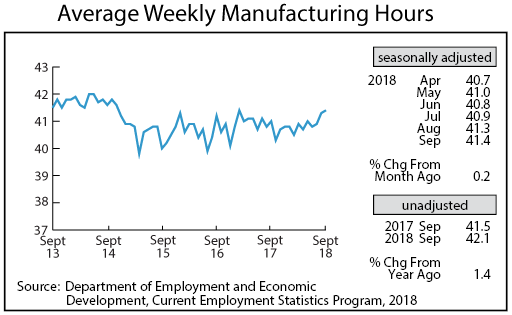
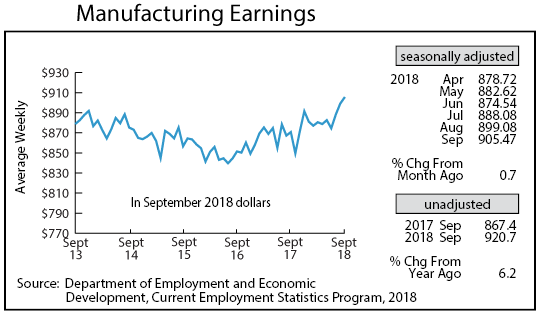
Adjusted average weekly Manufacturing Hours climbed for the third month in a row to 41.4. September’s factory workweek was at a 19-month high. Higher factory hours are probably from growing orders and difficulties finding new employees leading to increased overtime. Average weekly Manufacturing Earnings, adjusted for inflation and seasonality, also jumped sharply, reaching an all-time high of $905.47. The previous high was $899.32 recorded in May 2006.
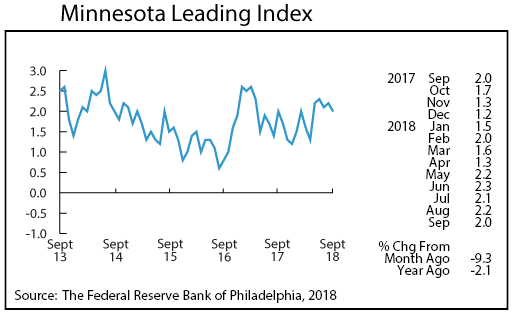
The Minnesota Leading Index slipped slightly in September, inching down to 2.0. The index remained higher than the U.S. index for the fifth straight month, indicating that Minnesota’s economic growth will outpace U.S. growth over the next six months. Minnesota’s index ranked 10th highest among states and continues to exceed the 36-year average of 1.5 percent.
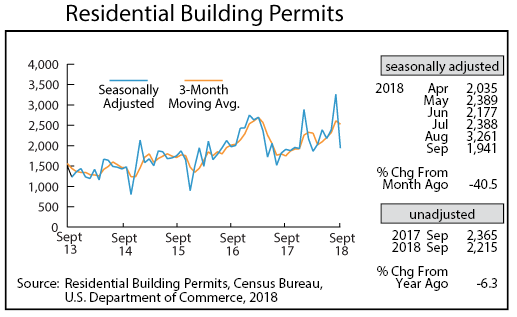
Adjusted Residential Building Permits retreated from a huge spike in August to 1,941 in September. Monthly permits have averaged 2,112 since 1970 and 2,456 through the first nine months of 2018. On an unadjusted basis Minnesota’s home-building permit level is up 20.2 percent through the first nine months of the year compared to 5.2 percent nationally. Most of the increase in the state is, however, from apartment building permits as single-home building permits in the state were down 0.3 percent from last year while up 5.2 percent nationally.
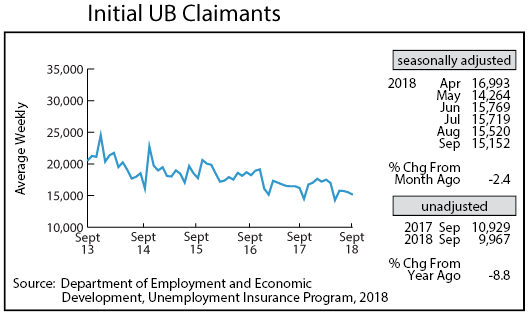
Adjusted Initial Claims for Unemployment Benefits (UB) dipped for the third consecutive month to 15,152. September’s level was the second-lowest of the year and is another indicator of how tight Minnesota’s job market has become. The number of employers letting employees go is low as replacing workers is becoming very challenging given the shrinking pool of unemployed workers. The low level of layoffs points towards additional job growth through the rest of the year.