by Dave Senf
October 2021
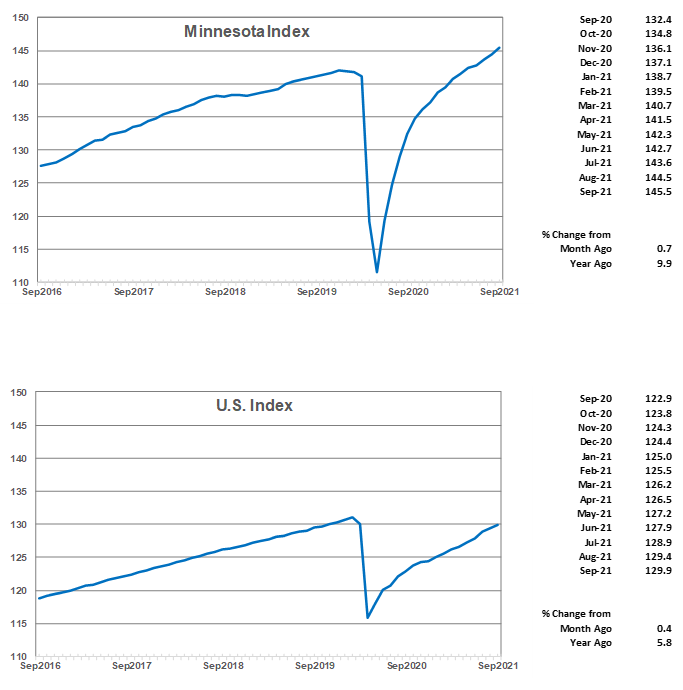
The Minnesota Index climbed for the 16th consecutive month in September, up 0.7% to 145.5, as the state's economy continues to rebound from the deep pandemic decline. The strength of the rebound slowed to a 0.3% monthly increase in June but has accelerated since as the monthly increase was 0.6% in both July and August. The index is a proxy for monthly GDP or economic activity that peaked at 142.0 in December 2019 before plunging to 111.5 in May 2020. The 145.5 reading in September suggest that the state's GDP is now 2.5% higher than pre-pandemic peak. The BEA's (Bureau of Economic Analysis) estimate of Minnesota's real GDP during the second quarter of 2021 was $344.1 billion, slightly above the previous all-time real GDP of $343.4 billion recorded during the fourth quarter of 2019. The U.S. Index increased 0.4% in September, slightly higher than the increase in August but down from July as it appears the delta variant spike continued to slow the U.S. economy more than the Minnesota economy.
The Minnesota Index, a coincident index, combines four state-level indicators to summarize current economic conditions in a single statistic which provides a proxy for monthly GDP. The four state-level variables in the coincident index are nonfarm payroll employment, average hours worked in manufacturing by production workers, the unemployment rate, and wage and salary disbursements deflated by the consumer price index. The Minnesota Index, along with similar indices for all 50 states, is produced by the Philadelphia Federal Reserve Bank.
The September readings were above February 2020 readings in 37 of the states. Minnesota, with a 2.3% gain, ranked 9th highest when comparing September 2021 to February 2020 readings. Utah (5.1%) and Idaho (4.0%) had the highest GDP growth over the period. Hawaii (-8.0%) and Connecticut (-7.6%) had the largest GDP drop compared to last February. September's change from last February for neighboring states was up in South Dakota (3.1%) and Wisconsin (0.9%) but lower in Iowa (-1.1%) and North Dakota (-2.3%).
August's index advance was powered by increasing wage and salary employment and rising real wage and salary disbursements as well as the state's unemployment rate which inched down to 3.7% from 3.8%. Employers continue to experience difficulties in finding workers to fill their vast number of job openings as the state's labor force remains significantly below pre-pandemic, 2.7% below February 2020 level or 83,300 workers. The unemployment rate in September was 3.7% compared to 3.3% in February 2020 with 7,400 more unemployed in September compared to February 2020. The spike in COVID-19 cases related to the delta variant hasn't seemed to slow Minnesota's economic growth at least through September.
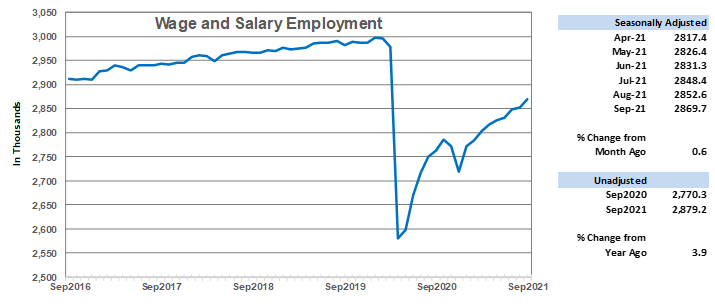
Adjusted Wage and Salary Employment increased 0.6% in September following a revised 0.1% gain in August. The state has added jobs in every month this year with the average monthly increase being 0.6%. Minnesota's job growth exceeded U.S. job growth in September. Minnesota's seasonally adjusted employment has grown 5.3% since December 2020 compared to the 3.7% gain nationwide. Minnesota's employers have added 146,300 jobs during the first nine months of 2021 despite struggling to fill their swelled job vacancies. As of September, the state has recovered roughly 70% of the 416,000 jobs lost during the pandemic. Nationally, 79% of the 22.4 million jobs lost across the nation last March and April have been recovered as of September.
Minnesota's private sector employers added 13,800 positions while the public sector cut 500 leaving the state with a net gain of 13,300 more jobs in September. The private sector has added 136,100 jobs (5.9% growth) so far in 2021 while the public sector has added 10,200 or 2.6%. Public sector job loss was in both state and local government. Most private sector jobs were in Leisure and Hospitality, Trade, Transportation and Utilities, Construction, and Professional & Business Services. Financial Activities, Manufacturing, and Other Services cut jobs.
Manufacturers lost 400 jobs in September then gained 2,700 in September for a two-month increase of 2,300. Construction, Logging and Mining, and Professional and Business Services are all showing seasonally adjusted employment levels above the February 2020 level. The 130,700 construction jobs in September were just 0.8% below the all-time monthly high of 132,000 set in February 2006.
September's unadjusted over-the-year change was 3.7%, slightly below the 4.0% national growth. Seasonally adjusted unemployment in Minnesota dropped to 3.7% while the U.S. rate declined to 4.8% in September.
Minnesota's 3.8% over-the-year increase in unadjusted employment was the 13th highest among the states. Hawaii and Nevada had the highest annual increases while Wyoming and Louisiana had the lowest annual increases. North Dakota (1.8%), South Dakota (2.0%), Iowa (2.4%), and Wisconsin (1.8%) all experienced slower over-the-year job growth than Minnesota.
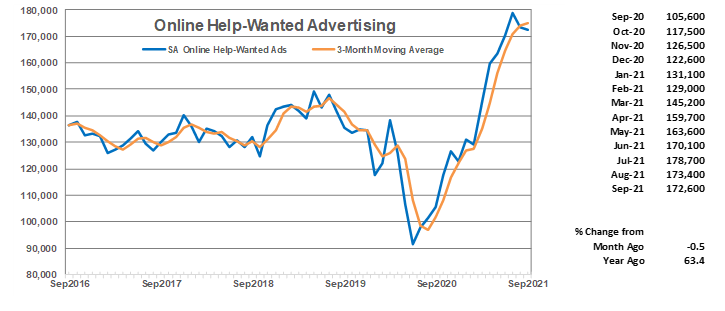
Online Help-Wanted Ads continued to decline in September, dropping to 172,600. September's 0.5% decline was smaller than the U.S. dip of 4.1%. Online help-wanted ads in Minnesota were 63% higher while nationally job postings were up 57% compared to a year ago. The demand for workers by Minnesota employers continues at an extremely robust level as the state rebounds from the pandemic.
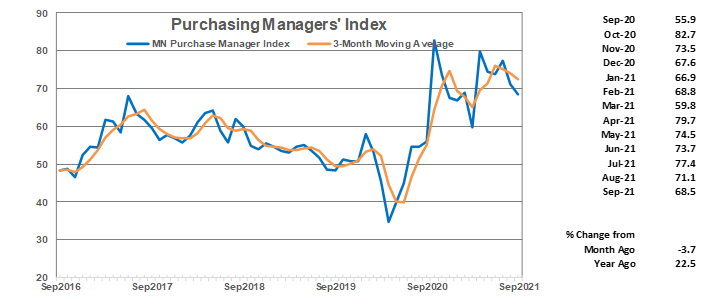
Minnesota's Purchasing Managers' Index (PMI) dipped to a six-month low in September, slipping to 68.5. The reading is still significantly above the monthly historical average of 55 signaling that manufacturers remain very confident about a healthy pace of expansion over the next six months despite supply chain bottlenecks and labor shortage headwinds. Manufacturing hiring in the state over the last two months has been strong which is another positive indicator that Minnesota's manufacturing sector is continuing to recover from the pandemic contraction.
The national ISM Manufacturing Index jumped to 61.1 in August while the Mid-America Business Index (nine states including Minnesota) dropped again to 61.6. As has been the case over the last few months, Minnesota manufacturers are more optimistic about manufacturing growth over the rest of the year relative to current level than their counterparts in most other states.
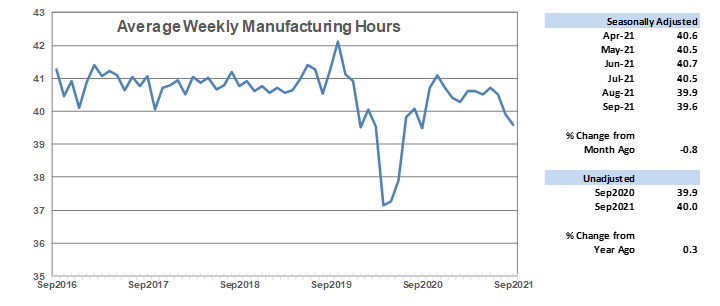
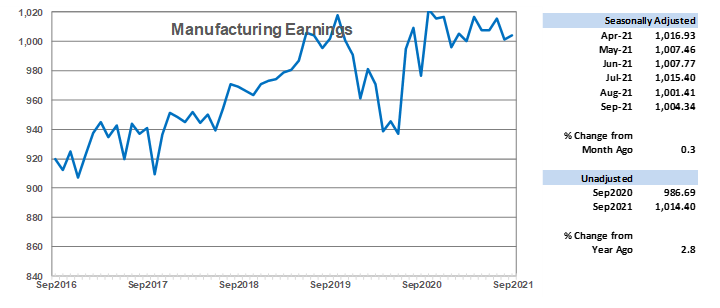
Average weekly Manufacturing Hours decreased for the third time over the last four months, fading to 39.6, the shortest factory workweek since September 2020. Declining hours is inconsistent with the strong PMI reading as well as the recent uptick in manufacturing hiring. Seasonally adjusted average weekly Manufacturing Earnings, adjusted for inflation, rose slightly to $1,004.34. Factory paychecks have bounced back from the pandemic recession plunge but have been relatively flat over the last few months despite Minnesota manufacturers' having a hard time finding workers to fill their vacancies. Seasonally adjusted real factory paychecks were 2.8% above last September.
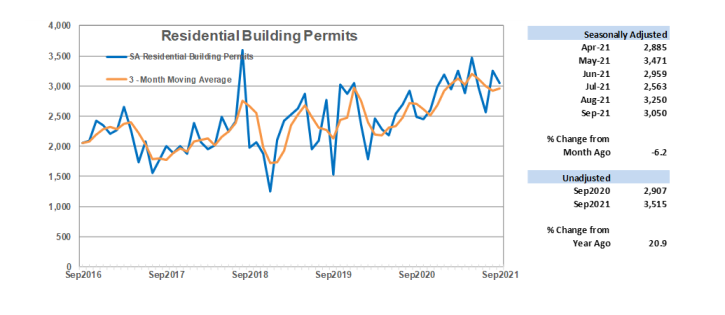
Adjusted Residential Building Permits, an early indicator of future home building activity, dropped slightly to 3,050. Home building permits are up 20.9% compared to last year. Permits have averaged just above 3,000 a month which hasn't occurred since the boom year of 2005. Median home prices continue to set record highs each month as home-builders scramble to meet demand despite labor shortages and supply chain problems.
The construction sector is the first sector to regain all the jobs lost during the pandemic recession.
Minnesota accounted for 2.3% of home building permits issued nationwide in August which tops the state's 1.7% share of U.S. population.
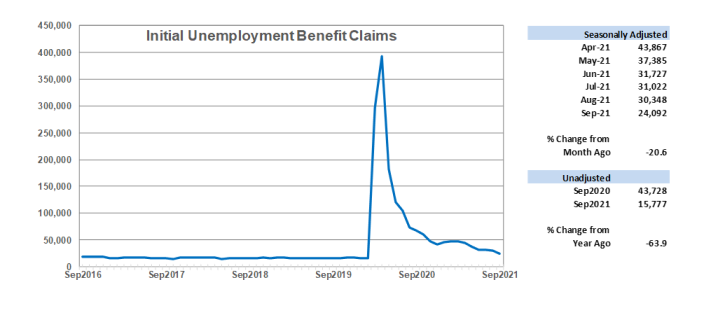
Adjusted Initial Claims for Unemployment Benefits (UB) fell to 24,092 in September. This continues the downward trend in monthly claims since March. Unadjusted jobless claims were 63.9% lower than a year ago but remain persistently above pre-pandemic levels. September's claim level was roughly 45% higher than the 2015 – 2016 seasonally adjusted initial jobless claims average.
Note: All data except for Minnesota's PMI have been seasonally adjusted. See the feature article in the Minnesota Employment Review, June 2010, for more information on the Minnesota Index.
The Philadelphia Federal Reserve Bank, which produces the Minnesota Leading Index, has temporary suspended generation of state leading indices.