
by Carson Gorecki
June 2021
The pandemic recession hit some industries harder than others, including those that are highly concentrated in Northeast Minnesota. Leisure & Hospitality is a key industry in the Arrowhead, making the most of the region's natural resources. Arts, Entertainment, & Recreation and Accommodation & Food Services combined to account for 11.1% of all jobs in Northeast. Statewide, the share of Leisure & Hospitality jobs was 9.4%.
Traditionally, much of the economic activity in the Arrowhead reflects the natural assets on offer. The region is home to the Iron Range and has a rich history of iron ore Mining. Location quotients show how relatively concentrated employment in an industry is relative to a larger area such as the state of Minnesota. Employment in the Mining industry is not only the most concentrated of all industries in the region, but also the most concentrated of any industry in any region in the entire state. The Mining industry is relatively small in absolute terms, accounting for only 3% of the region's jobs. However, the 3,889 Mining jobs in Northeast Minnesota represent 71% of the industry's employment statewide.
Less tied to the abundance of natural resources, Health Care & Social Assistance is the largest sector in the state, employing 18% of all workers. In Northeast Minnesota, the employment share for Healthcare is even larger at 25.1%. Compared to the other planning regions, only Southeast Minnesota has a higher share of health care workers (see Figure 1).
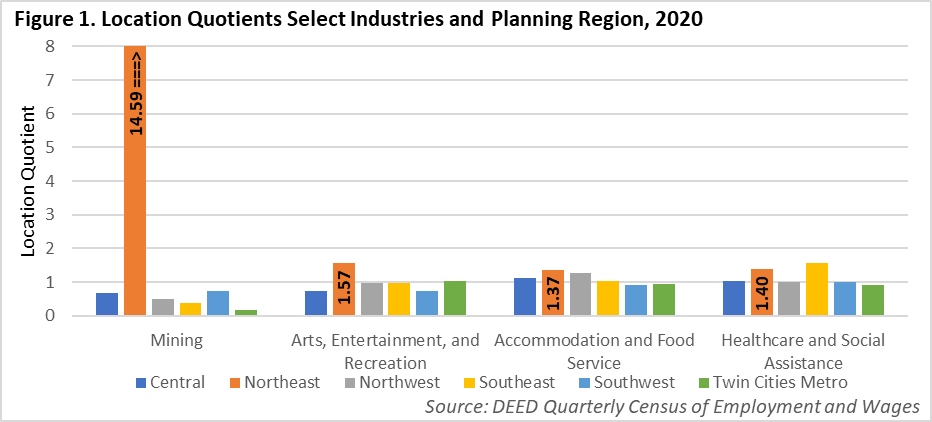
Where employment was concentrated by industry served to be an important determinant of how a region weathered the pandemic recession relative to other areas in the state. Leisure & Hospitality was by far the most impacted sector in terms of employment loss last year. While overall employment fell 11.8% between the first and second quarters, Accommodation & Food Service declined 35.8% and Arts, Entertainment & Recreation declined by 37.2%.
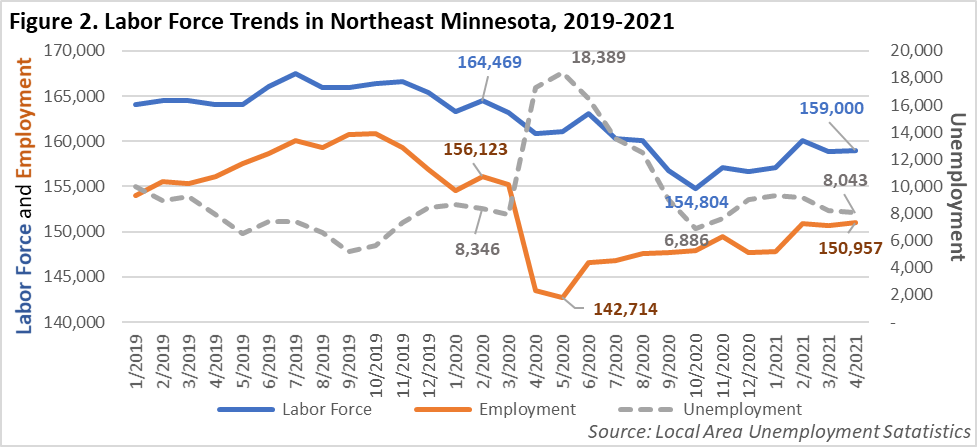
The number of jobs lost was not the only measure of impact from the pandemic. Not only did many workers get laid off, but many chose to leave the labor force altogether, forgoing a job search at least temporarily. As of April 2021, Northeast Minnesota's labor force is 5,469 workers, or 3.3%, smaller than it was in February 2020, before the onset of the pandemic. The lowest point occurred in October when the labor force bottomed out at 154,804 workers (see Figure 2). For context, the last time the region's labor force dipped below 155,000 was 1995, more than 25 years ago. Since that low point last fall, over 4,000 workers have returned to the labor force, but that's still less than half of those that exited. Such a large decline in the labor force meant that even as unemployment fell quickly, the gains in employment were not equivalent in scale.
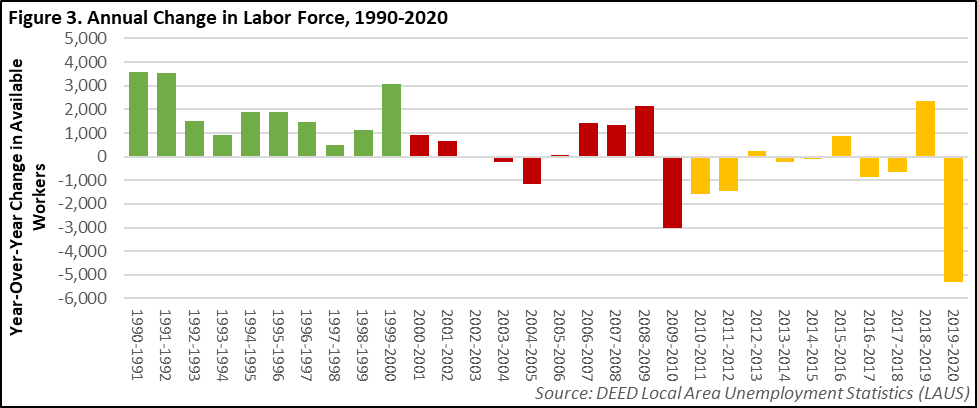
However, it is important to note that the decline of the labor force is not just a recent phenomenon in Northeast Minnesota. The pandemic recession accelerated what was a decades-long trend of labor force stagnation and decline. During the 1990s the regional labor force averaged an annual increase of almost 2,000 workers. However, since 2000, the annual change switched to a loss of 227 workers per year (see Figure 3). Labor force trends tend to follow larger population movements. As labor force growth slowed and eventually switched to labor force decline, so has the total population of the region – the former trend reflecting the latter. Modest population growth from 1990 to 2010 became modest population decline from 2010 to 2019 when the region saw a loss of 0.6% of the regional population1.
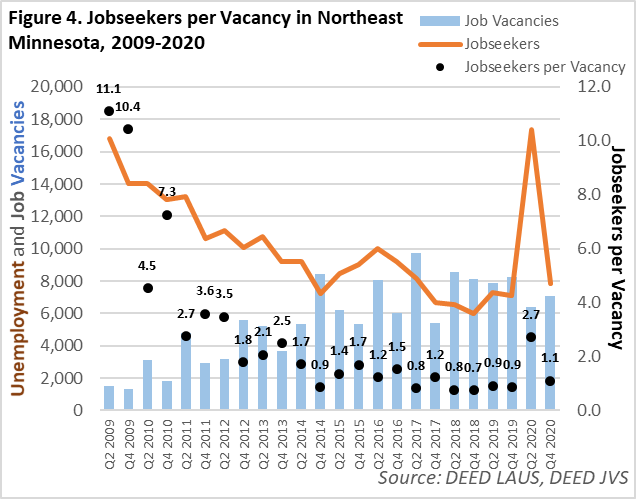 One consequence of a shrinking labor force is continued tightening of the labor force. Even with relatively high unemployment, job vacancies have stayed high, meaning that there are few potential jobseekers per opening (see Figure 4). For the workers that have stayed in the labor force, this likely means more options, but for employers it means greater competition for qualified applicants. We have reverted to the tight labor market conditions that existed prior to the pandemic. This occurred in less than a year as the jobseekers to vacancies ratio returned to near 1-to-1 at the end of 2020.
As was mentioned earlier, the effects of the pandemic did not fall evenly across industries. Service-Providing sectors experienced much larger employment declines than Goods-Producing sectors. From 2019 to 2020, employment in Arts, Entertainment, & Recreation and Accommodation & Food Services declined more than 20%. Other Services saw a similarly severe decline. Of the Goods-Producing sectors, only Construction had a larger than average employment decline. Instead, Mining (-7.8%), Manufacturing (-6.7%), and especially Agriculture, Forestry & Fishing (-3.6%) fared better.
Also faring better were several sectors that potentially were able to transition workers to telework more easily. Management, Public Administration, Utilities, and Professional, Scientific, & Technical Services all contain higher shares of more educated workers, which in turn correlated with increased incidence of telework during the pandemic2.
Table 1. Industry Employment Statistics in Northeast Minnesota, 2019-2020
| - | 2019 Employment | 2020 Employment | Employment Change 2019-2020 | Percent Employment Change (2019-2020) | Average Annual Wage |
|---|---|---|---|---|---|
| Arts, Entertainment, & Recreation | 3,771 | 2,806 | -965 | -25.6% | $26,520 |
| Accommodation & Food Services | 15,205 | 11,820 | -3,385 | -22.3% | $17,420 |
| Other Services (except Pub. Admin.) | 5,143 | 4,146 | -997 | -19.4% | $31,304 |
| Information | 1,311 | 1,131 | -180 | -13.7% | $51,896 |
| Admin. Support & Waste Mgmt. Svcs. | 3,434 | 2,966 | -468 | -13.6% | $32,292 |
| Real Estate & Rental & Leasing | 1,290 | 1,146 | -144 | -11.2% | $34,320 |
| Construction | 6,993 | 6,409 | -584 | -8.4% | $65,052 |
| Total, All Industries | 143,680 | 131,809 | -11,871 | -8.3% | $49,452 |
| Mining | 4,218 | 3,889 | -329 | -7.8% | $89,076 |
| Transportation & Warehousing | 4,217 | 3,890 | -327 | -7.8% | $53,664 |
| Finance & Insurance | 4,336 | 4,044 | -292 | -6.7% | $62,244 |
| Manufacturing | 8,902 | 8,310 | -592 | -6.7% | $64,324 |
| Wholesale Trade | 2,985 | 2,804 | -181 | -6.1% | $62,920 |
| Educational Services | 11,876 | 11,229 | -647 | -5.4% | $49,920 |
| Retail Trade | 17,075 | 16,223 | -852 | -5.0% | $29,588 |
| Health Care & Social Assistance | 34,606 | 33,054 | -1,552 | -4.5% | $54,184 |
| Agriculture, Forestry, Fishing & Hunting | 579 | 558 | -21 | -3.6% | $41,340 |
| Management of Companies | 754 | 729 | -25 | -3.3% | $92,404 |
| Public Administration | 11,156 | 10,875 | -281 | -2.5% | $56,940 |
| Utilities | 1,465 | 1,431 | -34 | -2.3% | $101,140 |
| Professional, Scientific, & Technical Svcs. | 4,360 | 4,345 | -15 | -0.3% | $67,600 |
| Source: DEED Quarterly Census of Employment and Wages | |||||
The harder hit sectors also tended to be lower-paying. Of the seven with greater than average over-the-year employment loss, only two paid above average wages. Construction's employment losses were near average and Information employment was on a long decline well before the onset of the pandemic. Of the thirteen sectors that fared better than average, only two – Retail Trade and Agriculture, Forestry, Fishing & Hunting – paid below average wages. The Retail sector was able to adapt in ways such as increased e-commerce that mitigated losses and the socially-distant and outdoor nature of much of the work in Agriculture, Forestry, Fishing & Hunting similarly insulated it from pandemic impacts.
While everyone has been affected in some way, the economic impacts of the pandemic have fallen disproportionately on Black, Indigenous and People of Color (BIPOC) Northeast Minnesota residents, low-wage earners, those with lower education attainment, the oldest workers, and women. DEED's Unemployment Insurance Statistics provide the most detailed and current look into the widespread layoffs that started in spring of 2020 and how they continue to ripple into 2021.
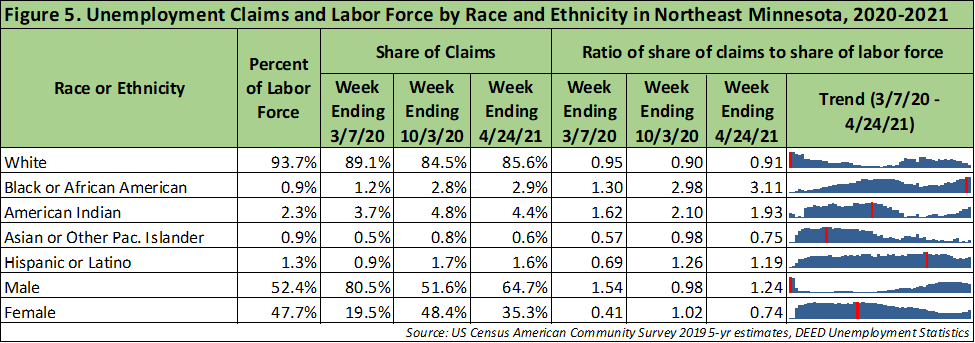
The share of Unemployment Insurance (UI) claims filed by Black or African American workers was – even as recently as April – three times larger than their share of the labor force. Indigenous workers were also overrepresented on UI, as were Hispanic or Latino workers. For BIPOC workers, the disparities were exacerbated by the pandemic. For Black or African American and Indigenous workers in the region, the disparities have actually started to widen again in 2021, even as overall unemployment claims fall.
The story for women workers was flipped from its usual script. Typically, men file UI claims at much higher rates than women. The pandemic led to a spike in claims filed by women, to the point that they were more than twice as likely to file claims last summer and fall as they were before March (see Figure 5). Workers 65 and older represented a larger share of filed claims (6.7%) than their share of the labor force (5.3%).
Lastly, those with less than a high school diploma were most likely to have filed a claim in 2020, followed by workers with a high school diploma and those with some college or an associate degree. Workers with a bachelor's degree or higher were less than half as likely as other workers to have filed a UI claim. So far, these disparities have worsened in 2021. Workers with less than a high school diploma accounted for 6.3% of UI claims in first 3 months of 2021 but represented only 3.3% of the labor force. Similarly, those with high school diplomas accounted for 41.8% of UI claims, but only 23.1% of labor force. Those with bachelor's degrees or higher filed only 11.9% of claims but accounted for nearly a third of the labor force in Northeast Minnesota.
While many signs point toward an economic recovery in Northeast Minnesota, the benefits of this rebound have yet to reach all workers.
1U.S. Census Bureau