by Dave Senf
November 2018
Note: All data except for Minnesota’s PMI have been seasonally adjusted. See the feature article in the Minnesota Employment Review, May 2010, for more information on the Minnesota Index.
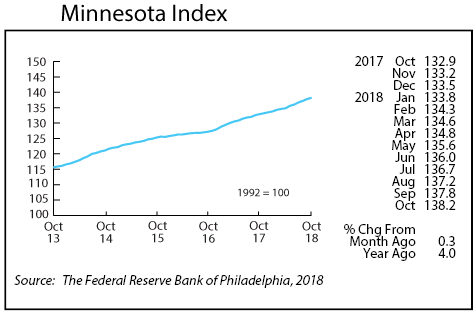
The Minnesota Index continued to climb in October but at a slightly reduce rate compared to the previous few months. October’s 0.3 percent advance was the slowest since June but still above the 39-year average of 0.2 percent. Wage and salary employment rose as did average weekly manufacturing hours, but the unemployment rate was unchanged.
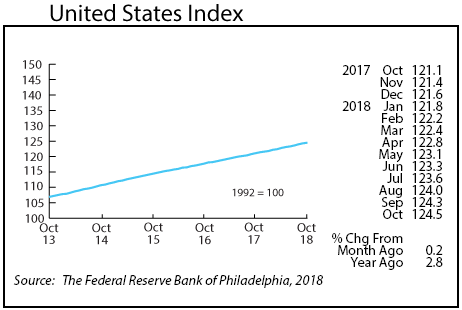
The 0.3 gain in the state’s index ranked Minnesota 28th among states and between California and Utah. Minnesota’s index, however, increased faster than the U.S. index for the sixth straight month. That is the longest Minnesota’s index has been above the U.S. index since the seven-month period from January to July 2014. The over-the-year increase was 4.0 percent for the Minnesota index compared to 2.8 percent for the U.S. index. Over-the-year index growth in Minnesota has exceeded U.S. growth for 20 consecutive months which signals that economic activity in Minnesota has expanded at a faster rate for almost two years.
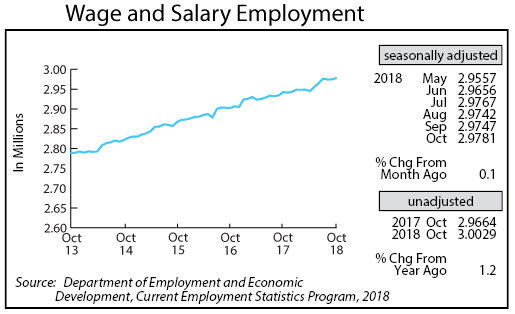
Minnesota’s adjusted Wage and Salary Employment jumped slightly in October after a slight decrease in September was revised away. Employers added 3,400 jobs in October which was right in the neighborhood of the 3,440 jobs added on average this year. On a seasonally adjusted basis the state’s employment has increased 34,400 through October using December 2017 as the starting point.
Private employers added 3,900 workers in October while the public sector cut 500 position. The bulk of employment gains came in Leisure and Hospitality and in Construction. Job cutbacks were the highest in Other Services, Professional and Business Service, and Government.
Minnesota’s unadjusted over-the-year job growth dropped another notch in October to 1.2 percent. The 1.2 percent increase translates into 36,500 new jobs over the year. U.S. over-the-year job growth continued to remain strong coming in at 1.7 percent for the second straight month.
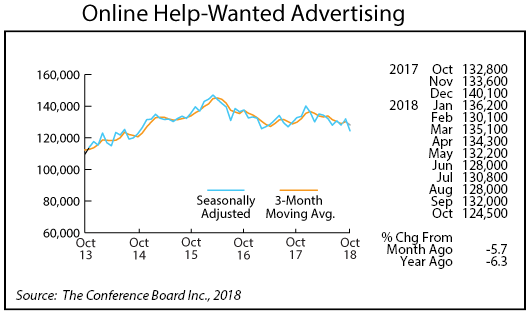
Online Help-Wanted Ads lost ground for the seventh month this year in October, dropping to 124,500, the lowest level since early 2014. Online job postings slipped 5.7 percent in Minnesota and 5.6 percent nationally in October. Online help-wanted ads peaked in Minnesota in March 2016 and in November 2015 nationally. Since then online job postings have gradually slipped both in Minnesota and nationwide. Minnesota job postings are down 15 percent from their peak while U.S. postings are down 22 percent. The decline over the last few years may be more nearly related to higher cost of online posting than to any softening in labor demand. Employers continue to report that they are having problems filling their job openings.
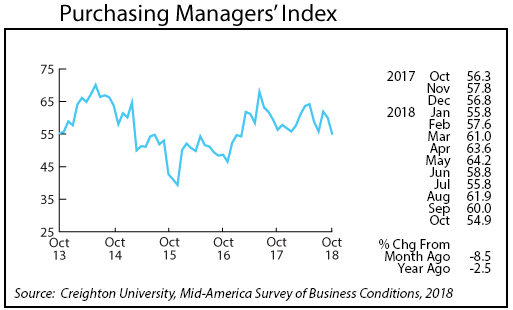
Minnesota’s Purchasing Managers’ Index (PMI) waned for the second month in a row in October, sliding to 54.9. That is the lowest reading since February 2017. The decline may be from shortages of skilled workers and negative impacts from tariffs and trade disruptions. The comparable national index also retreated in September to 57.9 as did the Mid-America Economic Index which retreated to 54.9. The Minnesota index, however, remains comfortably above the 50-point mark that indicates expansion rather than contraction of manufacturing activity in the state.
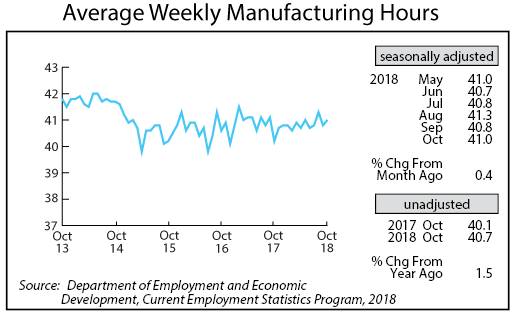
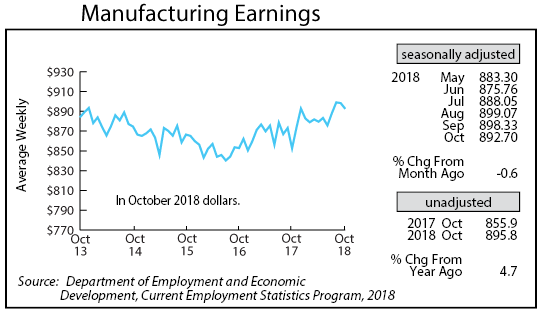
Adjusted average weekly Manufacturing Hours, after tailing off in September, climbed a bit in October to 40.8 hours. Average weekly Manufacturing Earnings, adjusted for inflation and seasonality, declined for the second month in a row but were still up 4.5 percent from a year ago.
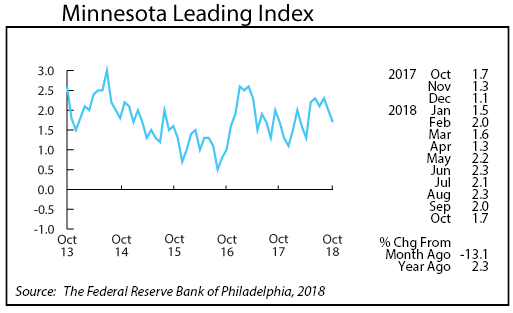
The Minnesota Leading Index dipped for the second consecutive month in October, falling to 1.7, its lowest level since April. The U.S. leading index was 1.4 as Minnesota’s index topped the U.S. index for the sixth straight month. The Minnesota leading index decline over the last two months suggests that Minnesota’s economy is losing some momentum and that growth over the next six months will be lower than the recent solid rate.
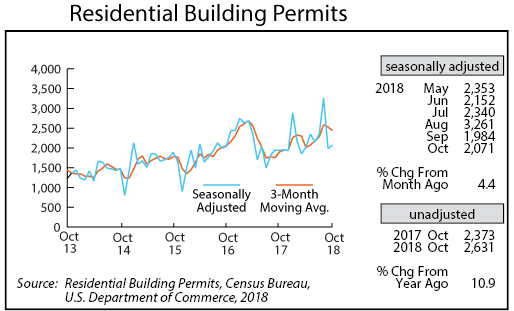
Adjusted Residential Building Permits inched up in October after a big drop in September. October’s 2,071 home building permits were just a tad below the 2,307 averaged so far this year. Home building permits averaged 2,102 in 2017, so at least through October home building permits are up 9.8 percent from last year.
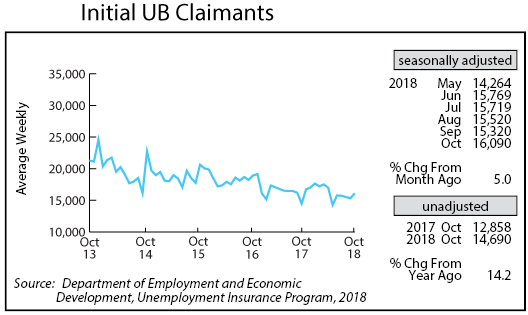
Adjusted Initial Claims for Unemployment Benefits (UB) rose for the first time in four months in October to 16,090. Initial claims haven’t been this high since April. The uptick in initial claims, however, was small, and initial claim levels remain well below historical averages. Total initial claims through October are roughly the same as over the same period last year.