by Amanda Rohrer
August 2019
Restaurants play a unique role in our economy and culture. They are both a support service for other industries, such as recreation or office workers, and an attraction in themselves. While food is the stated product, sometimes they're selling atmosphere or novelty or an experience as well. Difficult hours and high turnover rates mean the available workforce is a major factor in restaurant success. The need to meet code requirements for a commercial kitchen ties them more tightly to certain locations and increases the barriers to entry for new establishments, which means they can be slow to respond to trends. But what are those historical trends, and how are they changing? Where do restaurants locate, and how do they respond to demand? How are Minnesota restaurants different from other states or nationally? The topic is worth a deep look.
The North American Industry Classification System (NAICS) is the coding system used to assign industries to businesses. It spans Agriculture to Public Administration and can either be used broadly or with very narrow definitions. Restaurants – food-serving establishments open to the public – fall mostly within the broad sector 72: Accommodation and Food Services. The specific establishment types within that include the following:
Bars (NAICS 722410) – Sell mostly alcohol
Full Service Restaurants (NAICS 722511) – Where waitstaff come to tables to take orders
Limited-Service Restaurants (NAICS 722513) – Where food is ordered at a counter
Cafeterias, Grill Buffets, and Buffets (NAICS 722514) – Where food is self-service
Snack and Nonalcoholic Beverage Bars (NAICS 722515) – Coffee shops and smoothie or pretzel shops
Breweries (NAICS 312120) – Beer manufacturers
There are some additional industries that are not included.
Mobile Food Services (NAICS 722320) – This includes hot dog stands, fair stalls, and food trucks
Caterers (NAICS 722320) – Businesses that provide food for events rather than at their own location
Assigning these codes is not always clear-cut, and local trends or laws may limit the types of establishments and how they're described. Furthermore, eating establishments that are part of another business (a cafeteria provided by an employer or a restaurant in a zoo) may be treated as its own establishment in the data or may not, depending on the legal and accounting structures of the establishments in question. Particularly with the excluded NAICS codes (food trucks and caterers), many restaurants perform these services. The business is coded to its "primary" activity, but there are different ways to determine that. If a business has a physical restaurant but pulls in more money from the catering work, which is the primary activity? If a business started as a food truck and has greater visibility and brand loyalty at events but opens a restaurant of the same name, which is the primary activity? States have rules and priorities for making these decisions, but since each state handles the industrial coding of establishments within its borders, there may be inconsistencies across states or through time.
The primary dataset that looks at industries and the businesses within them is the Quarterly Census of Employment and Wages (QCEW). It starts with the universe of unemployment insurance covered employment and administrative records from it, then is reviewed and edited to ensure that employer-submitted data are accurate. This is a state-federal cooperative program where states all adhere to the same federal standard methods and definitions, but work is done at the state level. Industry coding of the QCEW universe is very good overall, but this analysis uses very granular data, and in evaluating the output there are many valid reasons why a specific establishment may not be included. Understanding these reasons helps give context to the data and their interpretation.
Why is a manufacturing industry (Breweries - 312120) included?In 2011 the Surly Bill took effect, allowing breweries to serve beer directly to customers. In the chart below you see the total count of breweries since 2000 statewide and in the Twin Cities metro – they were largely stable in the first decade of the 2000s, but since the passage of the bill have skyrocketed. Given how many breweries have been founded since that activity was allowed, it stands to reason that a core part of their business model is directly serving customers and makes it likely that most breweries are presently serving alcohol in addition to making it. Although breweries often rely on outside vendors for food sales, they now fulfill the same kind of social role that restaurants do in Minnesota.
|
Nationwide restaurants and bars (the NAICS codes described above) make up 9.1 percent of employment and 6.2 percent of establishments. While the percent of restaurant establishments varies from 8.8 percent in Puerto Rico to 4.9 percent in California, employment percent in restaurants is remarkably consistent across states. The mix of types of restaurants can vary more significantly.
Location Quotient is a measure of industry concentration – the ratio of industry employment to overall employment in a region is compared to the ratio of the same industry to overall employment in a larger (usually U.S. total) region. A Location Quotient of 1 means a normal distribution of businesses, under 1 is an unusual lack of businesses, and over 1 is a higher than typical concentration.
In Chart 1 below the yellow box indicates the zone of normalcy – when Location Quotients are between 0.5 and 1.5, the distribution is not very different than nationally. All states have a restaurant Location Quotient that's close to 1 and falls within this box, but for bars it's different. Only a few states have abnormally low Location Quotients, and many of them are states with historically restrictive liquor laws in the South or Utah. The outliers at the high end tend to be midwest and western states with lower population and more rural areas. Minnesota is not an outlier, but with a Location Quotient of 1.38 it's much like its neighbors. The dotted blue line shows the relationship between the two – its downward slope indicates that states with more bars typically have fewer restaurants and vice versa.
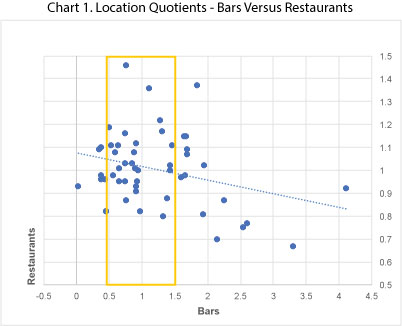
Although Location Quotients are useful for understanding the national norms, restaurants and eating and drinking establishments is a large category, and the mix of the business types within it also varies from state to state and by degree of urbanization. For this reason, it's also helpful to consider the proportion of each establishment type within a region. In Chart 2 below this mix of establishment types is laid out in more detail.
| Chart 2 | ||||||||
|---|---|---|---|---|---|---|---|---|
| - | Restaurant Percent Of Total | Percent of Restaurants | Restaurants Per Thousand | Per Capita Income | ||||
| Bars | Full Service | Limited Service | Buffets | Snacks | ||||
| U.S. Total | 6.2% | 7.8% | 40.8% | 40.1% | 1.1% | 10.2% | 1.88 | 50,392 |
| MSA | 6.6% | 7.3% | 40.4% | 40.6% | 1.0% | 10.7% | 1.90 | 53,539 |
| Non-MSA | 4.7% | 10.6% | 42.8% | 37.5% | 1.7% | 7.4% | 1.88 | 40,889 |
| Minnesota | ||||||||
| 7-County Metro | 6.5% | 6.7% | 37.1% | 44.4% | 1.0% | 10.9% | 1.74 | 53,182 |
| Balance of State | 5.8% | 11.7% | 38.8% | 40.3% | 0.8% | 8.4% | 1.77 | 53,043 |
| Top 3 by Percent Bars | ||||||||
| North Dakota | 5.6% | 27.7% | 31.7% | 29.5% | 1.2% | 9.9% | 2.23 | 54,643 |
| Wisconsin | 7.3% | 25.9% | 37.2% | 29.3% | 0.7% | 6.8% | 2.11 | 47,850 |
| Montana | 5.8% | 23.0% | 38.6% | 26.6% | 0.6% | 11.2% | 2.69 | 43,907 |
| Top 3 by Percent Limited Service | ||||||||
| Alabama | 6.8% | 3.9% | 35.0% | 52.8% | 2.6% | 5.7% | 1.68 | 39,976 |
| Mississippi | 6.6% | 2.5% | 35.7% | 51.7% | 3.3% | 6.9% | 1.54 | 36,346 |
| Maryland | 6.2% | 5.8% | 32.8% | 50.5% | 0.8% | 10.1% | 1.76 | 59,524 |
| Top 3 by Percent Grills and Cafeterias (includes Mississippi, above) | ||||||||
| Puerto Rico | 8.8% | 3.9% | 27.2% | 50.1% | 11.1% | 7.7% | 1.09 | NA |
| West Virginia | 6.8% | 10.3% | 36.3% | 44.0% | 3.3% | 6.0% | 1.73 | 37,924 |
| Top 3 by Percent Coffee and Snack Shops | ||||||||
| Alaska | 6.8% | 13.2% | 38.9% | 29.7% | 0.7% | 17.6% | 1.84 | 56,042 |
| Washington | 6.2% | 8.1% | 41.7% | 32.5% | 0.5% | 17.2% | 2.11 | 56,283 |
| Rhode Island | 7.3% | 10.5% | 41.4% | 31.6% | 0.3% | 16.1% | 2.56 | 51,503 |
| Top 5 States by Per Capita Income | ||||||||
| District of Columbia | 5.7% | 7.6% | 43.7% | 37.5% | 1.5% | 9.8% | 3.26 | 76,986 |
| Connecticut | 6.5% | 4.7% | 45.7% | 34.5% | 0.8% | 14.4% | 2.12 | 70,121 |
| Massachusetts | 5.8% | 5.4% | 41.4% | 36.7% | 0.4% | 16.0% | 2.14 | 65,890 |
| New Jersey | 6.6% | 6.2% | 42.2% | 38.3% | 0.6% | 12.7% | 1.92 | 62,554 |
| New York | 7.6% | 7.8% | 43.7% | 36.7% | 0.5% | 11.3% | 2.39 | 60,991 |
The federal government defines different types of areas for analytical purposes. The most common is Metropolitan Statistical Areas (MSAs). Counties that meet population thresholds and nearby ones that send a significant number of commuters are combined into county-based urban areas for many federal reporting purposes. Below we compare several different and sometimes overlapping areas. MSA uses current federal definitions to define urban counties roughly; "rural" is used to describe counties not in MSAs. Minnesota publishes the same data for smaller county-based planning regions, one of which is the Seven County Twin Cities area.
States with a lot of bars tend to be more rural. States with a lot of limited service restaurants tend to have low incomes, Maryland excepted. Grills and Cafeterias are also prevalent in low-income states. Coffee and snack shops tend to be well-represented in affluent states. Full service restaurants are both prevalent in non-MSA counties and in the highest income states. Looking at the top ranked states by percent full-service therefore can be mixed in results.
Minnesota overall has a slightly lower percent of total restaurants than the U.S., and the metro has a slightly lower percent of total restaurants than the MSA total, but near enough that both could be considered average. The percent of restaurant establishments that are bars is slightly low in the metro, but high statewide, suggesting that our rural areas are like the other rural midwest and western states that have a high proportion of bars. Income in Minnesota is somewhat higher than average and with less of an urban/rural gap than nationwide. However, despite those two factors which correlate with prevalence of full-service restaurants nationwide, both the metro and the state as a whole have somewhat high limited service restaurant proportions and lower than typical full-service restaurant proportions. Perhaps this has to do with endemic introversion which leads Minnesotans to avoid social interaction, but could also have to do with the expense of employees. Minnesota is the only midwestern state that requires that tipped workers receive the full minimum wage. Of the seven states that have that requirement most are on the West coast and border one another. Four have lower median incomes than the national average and two, Alaska and Washington, have high proportions of full-service restaurants. More recently the proportion may be tied to increasing local minimum wage laws in the urban core. Minneapolis and Saint Paul have both passed legislation requiring a $15 minimum wage by 2022. While not yet in effect, the climate that made that possible may also have favored less human intensive restaurants. Because Minnesota and the metro in particular differs from the surrounding economy the impact may be more noticeable.
In keeping with its higher incomes, Grills and Cafeterias make up an average or low share of Minnesota restaurants. Similarly, Snack and Beverage bars are prevalent in the metro, although a little under-represented statewide. In terms of number of establishments, both Minnesota as a whole and the Twin Cities have fewer restaurants per thousand residents than the U.S. as a whole – 1.74 compared to 1.9 in the metros and 1.77 compared to 1.88 in the U.S. as a whole. Minnesotans are more likely to be lured out of their caves for alcohol and favor a more casual atmosphere than is dominant nationally. Tastes for snack bars and not for buffets is in keeping with higher than national average income levels.
While there has been some growth in the number of restaurant establishments, the 2007 recession took a significant toll and only in the past couple of years have restaurant establishments recovered to their pre-recession highs. In Chart 3 the right (statewide) scale is twice the left (metro only) scale. In 2000 the number of restaurant establishments in the Seven-County Metro was almost exactly half of the state total, but by 2005 growth in the metro was faster than in the state as a whole. Since the recession the state trend closely matches that of the metro (which follows, since more than half of the state businesses are in the metro), but since the recession the pace of restaurant growth has been greater in the metro than statewide.
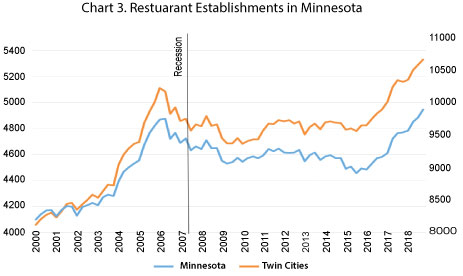
It's clear that population and population density play a significant roll in the viability of an eating establishment, both in terms of the market for their product and for the workforce and physical resources needed to operate (see Chart 4).
| Chart 4. Restaurants per Thousand Residents, 2018 | |
|---|---|
| Area | Indicator |
| Minnesota | 1.77 |
| Seven County | 1.74 |
| Minneapolis | 2.66 |
| Saint Paul | 1.79 |
| Suburban | 1.57 |
| Non Metro | 1.80 |
| Duluth | 2.36 |
In Minnesota overall there are 1.77 restaurants per thousand people. The Seven-County Metro, which makes up more than half those people, is approximately similar at 1.74 per thousand people. Minneapolis and Duluth are much higher, at 2.66 per thousand and 2.36 per thousand, respectively. The lowest geographic type is suburban - the balance of counties less Minneapolis and Saint Paul for the Seven-County Metro - at only 1.57 restaurants per thousand people.
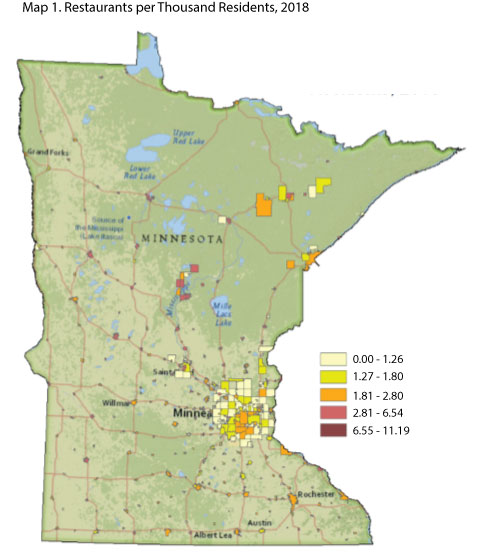
But urban and rural are not so easily defined. There are different kinds of communities – bedroom communities near the metro can be very different than a city of a similar size and density that's far from other population centers. The physical size of a city is wildly inconsistent across the state, and there are physical barriers such as rivers, lakes, and highways that make some areas more isolated than distance alone.
Of the 88 cities with populations over 1000 people (population from ACS five-year, 2013-2017; restaurant counts from QCEW 2018 Q2) where restaurants per thousand people was below 1, 69.3 percent (61 towns) were suburbs to major (MSA) cities. As suburbs, they are in close proximity to other towns and population centers.
Examining the outliers (cities with more than 4.5 restaurants per thousand residents), some trends become apparent. Many of the communities are near natural amenities regarded as tourist destinations. The top cities by restaurants per thousand are in Chart 5.
| Chart 5. Cities by Restaurants per thousand Residents, 2018 | |||
|---|---|---|---|
| Cities have minimum population 1,000, more than 4.5 restaurants per thousand | |||
| City | Population | Restaurants per Thousand | Area |
| Grand Marais | 1,340 | 11.19 | tourist town |
| Excelsior | 2,345 | 8.96 | Lake Minnetonka |
| Rice | 1,377 | 7.26 | - |
| Long Lake | 1,831 | 7.10 | Lake Minnetonka |
| Falcon Heights | 5,617 | 6.23 | - |
| Wayzata | 4,592 | 6.10 | Lake Minnetonka |
| Parkers Prairie | 1,003 | 5.98 | - |
| Taylors Falls | 1,024 | 5.86 | - |
| Crosslake | 2,277 | 5.71 | Brainerd |
| Lexington | 2,029 | 5.42 | - |
| Ely | 3,356 | 5.36 | tourist town |
| Nisswa | 2,054 | 5.36 | Brainerd |
| Roseau | 2,660 | 5.26 | - |
| Park Rapids | 4,214 | 5.22 | Brainerd |
| Winthrop | 1,367 | 5.12 | - |
| Pine City | 3127 | 5.12 | on the Duluth-Minneapolis corridor |
| Warroad | 1796 | 5.01 | - |
| Slayton | 1997 | 5.01 | - |
| Aitkin | 2001 | 5.00 | - |
| New London | 1403 | 4.99 | - |
| Wabasha | 2477 | 4.84 | tourist town |
| Richmond | 1452 | 4.82 | - |
| Milaca | 2914 | 4.80 | - |
| Lake Shore | 1050 | 4.76 | Brainerd |
| Hinckley | 1925 | 4.68 | on the Duluth-Minneapolis corridor |
| Waite Park | 7718 | 4.66 | - |
Outside the suburbs where overall population density is lower, most cities with populations over 1000 have higher than average restaurants per capita. This is likely caused by their status as a draw for nearby rural residents. Interestingly, the three biggest cities (Minneapolis, Saint Paul, and Duluth) all have restaurant concentrations higher than or comparable to the state overall, but are not nearly as high as smaller out-state towns.
Restaurants are destinations or locate near destinations. In rural areas this means tourist towns and areas with other shopping or recreational opportunities. Within urban areas "destination" is more granular. In an urban center the tourist destinations (theaters, museums, regional parks, shopping) tend to be intermingled with high-density residential areas. City boundaries don't restrict the pull of a destination, and the overall volume of people is much higher. Sometimes what makes an area a destination is not just the amenity, but also the available pathways to it – train lines and bike trails may attract a different kind of customer than shopping malls. The prevalence and use of alternate modes of transport may also create different kinds of barriers. A highway between suburbs is a connection, but a highway between a downtown and a neighborhood may be an insurmountable obstacle to a pedestrian.
Instead of relying on existing political boundaries to summarize economic features of restaurants, then, we have to look at the geographic features themselves. Retail clusters – clusters of customer-facing businesses, as defined by proximity to each other – are the approach used to identify these non-political or administrative districts.
Restaurants have high barriers to entry. Kitchen prices are high, real estate prices are high, the business is risky, and so financing is difficult or unavailable, forcing owners to shoulder the burden. Further, small businesses don't have the services or (possibly) the skills of market analysts to help them choose locations or determine a fair purchase price for a property. Regulations vary, sometimes widely, between municipalities, and even an experienced small restauranteur may not be able to apply prior lessons to a current situation. The business itself has operating challenges – managing supply of perishables, menus, marketing, staffing. Because of these challenges, restaurants have an incentive to locate in retail clusters. Other businesses have an established customer base, appropriate food preparation facilities may already exist, and there's more concrete and less speculative information available about the available market. Locating near other businesses reduces risk. If other businesses are successful, it's likely that there is sufficient traffic and market demand and employees. It can serve as a proxy when specific data and analysis are not available. Zoning issues may also be at play – existing businesses are in areas zoned for commercial use, or sometimes a non-conforming use can be grandfathered in even when the structure changes hands.
This analysis uses second quarter 2018 Minnesota Quarterly Census of Employment and Wages (QCEW) data. Second quarter includes somewhat seasonal establishments like those in parks and with patios as a major draw, but excludes state fair vendors which are often open only in August. The purpose is to capture institutions that residents recognize and rely on.
To define shopping and restaurant districts we took all establishments coded to any of the restaurant NAICS (7224,7225,312120) along with establishments in retail trade, entertainment, post offices, photo copy shops, and other businesses that tend to be customer-facing and assigned a buffer of 280 feet to accommodate urban blocks of 500+ feet. Those buffer zones were merged where they touched to approximate retail districts that would feel cohesive and walkable. The rationale was that having additional businesses within the line of sight would spur shoppers on and feel connected as a destination. Restaurant characteristics can be summarized by the size and density of these regions, rather than political boundaries.
In dense urban areas retail clusters can become very large. In suburban areas these tend to be shopping malls, clusters of gas stations and retail, or strip malls. Statewide 78.8 percent of retail and restaurant establishments as defined above fall within clusters. In other words, they're within 560 feet of at least one other customer-facing establishment. The regions where this is least likely to be true are rural – 72.9 percent of retail and restaurant establishments outside Duluth and the Seven County Metro are in clusters. Because of the different structure of the built environment of rural communities – more reliance on wider highways as main streets, presence of drainage ditches that may push business further from the road, lower land costs that make larger lot sizes the norm, as well as technical challenges that make placement of the specific point of the address more difficult on rural roads – there are likely to be clusters that simply fall outside the threshold for this study, but there are also lower barriers to entry, such as licensing requirements or specialized buildings, for many types of businesses making it feasible to run them out of homes or otherwise not locate near other establishments (see Chart 6).
| Chart 6. Percent of Establishments in Clusters, 2018 Q2 | |||
|---|---|---|---|
| Area | Restaurant | Retail | Overall |
| Seven County Metro | 91.1% | 80.6% | 83.5% |
| Minneapolis | 93.7% | 89.9% | 91.3% |
| Suburbs | 90.3% | 78.2% | 81.2% |
| Saint Paul | 91.4% | 86.5% | 88.2% |
| Duluth | 95.7% | 71.9% | 73.5% |
| Non Metro | 77.6% | 82.9% | 86.3% |
| Statewide Total | 85.5% | 71.3% | 72.9% |
The greater overall density of the urban core means that there are more clusters in the cities (in Minneapolis 91.3 percent are in clusters, Saint Paul is 88.2 percent, Duluth is 86.3 percent) while the suburban Seven County Metro (not in Minneapolis or Saint Paul) is similar to the state total at 81.2 percent of customer-facing businesses in clusters.
Restaurants seem to be more dependent on clusters than other types of retail (see Chart 7). Statewide, 85.6 percent of restaurants are in clusters of two or more customer-facing businesses, while only 76.4 percent of non-restaurant retail establishments were in clusters. In Duluth the gap was largest, with 95.7 percent of restaurants in clusters and only 83.0 percent of retail establishments in clusters. In all regions restaurants were more commonly in clusters than retail, and degree of density was greater where population density was greater.
| Chart 7. Percent of Restaurants in Clusters by NAICS, 2018 Q2 | |||||||
|---|---|---|---|---|---|---|---|
| Area | 312120 Breweries | 722410 Drinking places, alcoholic beverages | 722511 Full-service restaurants | 722513 Limited-service restaurants | 722514 Cafeterias, grill buffets, and buffets | 722515 Snack and nonalcoholic beverage bars | Total |
| Seven County | 76.8% | 85.6% | 93.3% | 95.0% | 75.7% | 95.6% | 91.1% |
| Minneapolis | 95.5% | 92.1% | 96.2% | 95.6% | 83.3% | 94.4% | 93.7% |
| Suburban | 62.5% | 83.8% | 91.6% | 94.9% | 73.1% | 95.3% | 90.3% |
| SaintPaul | 70.0% | 80.0% | 96.4% | 94.7% | 80.0% | 100.0% | 91.4% |
| Duluth | 100.0% | 96.8% | 98.7% | 94.2% | 100.0% | 100.0% | 95.7% |
| Non Metro | 71.0% | 69.5% | 73.5% | 88.3% | 56.5% | 92.3% | 77.6% |
| Total | 75.6% | 74.9% | 84.3% | 92.4% | 69.8% | 94.8% | 85.5% |
Retail clusters are clearly important to the location decisions of restaurants, signifying the availability of potential customers. What role does the size of those clusters play? Are there diverging patterns in urban core, suburbs, and non-metro areas? Do the demographics of the locality make a difference? Can the size of the cluster predict the size of the restaurant? Do different types of restaurants rely more heavily on clusters?
Saint Paul's retail clusters are linear, except for downtown which caters to office workers.
Minneapolis has more density overall, but also more clumping, which results in multi-street districts.
Inner-ring suburbs also have linear retail districts, while further out clusters become small clumps thanks to street configuration.
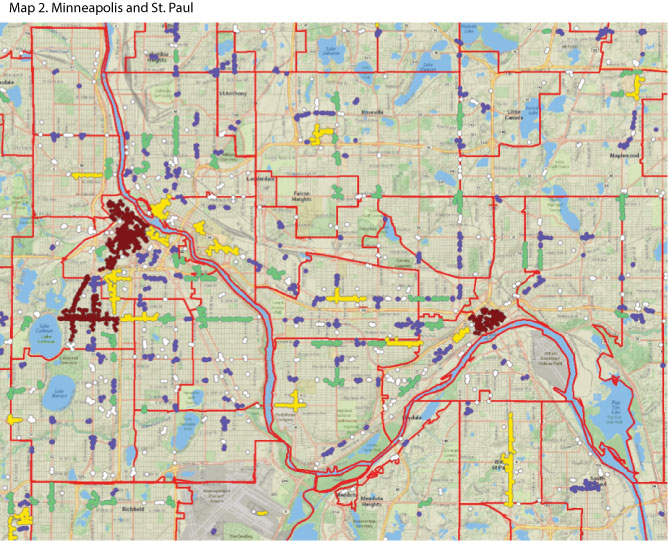
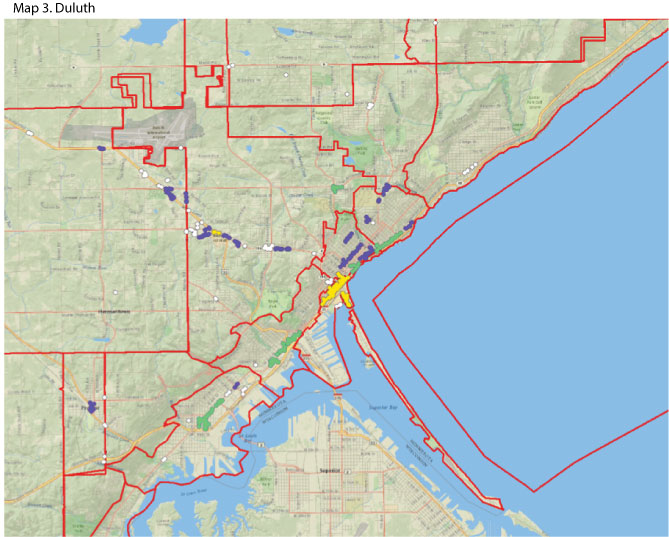
The maps are meant to give a sense of what areas hit the thresholds of a cluster and to help readers visualize 560 feet on a map. The overall patterns are important to understand, but the coming analysis groups clusters by size instead of looking at specific individual clusters. The colors indicate the size of the cluster as described below.
White - Category A: 1 Restaurant
Blue - Category B: 2-5 Restaurants
Green - Category C: 6-15 Restaurants
Yellow - Category D: 16-50 Restaurants
Brick - Category E: 51+ Restaurants
Here in Minneapolis and Saint Paul the largest districts are familiar – the downtowns and Uptown. Streets that tend to be dining destination are also easily spotted – Lake St, Summit/Grand, University, and West Seventh. Most of the campuses and some heavily trafficked intersections are also mid-sized clusters. Clusters even in inner ring suburbs and North Minneapolis already drop off in frequency and density, though, and the pattern intensifies further out (see Map 2).
This view of Duluth illustrates a long stretch of road that may be regarded by residents as a general commercial road, but because it's a highway rather than an urban street the buffer threshold has split it into several smaller regions. Wide cross streets and large front-of-building parking lots that are common outside the urban core take up a lot of space. But perceptions of space can vary, too. From a methodology standpoint, selecting a threshold that makes sense both with development patterns and perceptions and that can be applied statewide is a challenge; this distance – 280 feet – minimizes obvious failings but can't eliminate them all (see Map 3).
Overall, 24.8 percent of restaurants are in a cluster where they are the only restaurant. A restaurant can be in a cluster with other retail and no other restaurants. This is driven by the non-metro category, where 35.3 percent of restaurants were alone in their cluster (see Chart 8). In more urban areas fewer than 15 percent were the only restaurant in their cluster. Category B was largely around 30 percent except for Minneapolis and Duluth which had larger clusters.
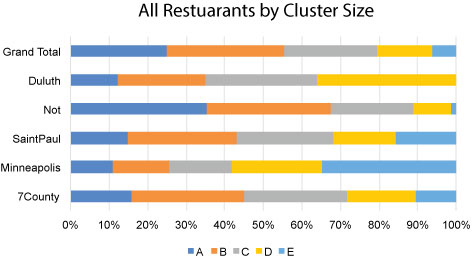
| Chart 8. Proportion of Restaurants in Cluster Category | |||||
|---|---|---|---|---|---|
| A | B | C | D | E | |
| Seven County | 15.9% | 29.1% | 26.9% | 17.8% | 10.4% |
| Minneapolis | 10.9% | 14.6% | 16.3% | 23.3% | 34.9% |
| Saint Paul | 14.9% | 28.2% | 25.0% | 16.3% | 15.5% |
| Not Seven County | 35.3% | 32.3% | 21.1% | 9.9% | 1.3% |
| Duluth | 12.4% | 22.8% | 28.7% | 36.1% | 0.0% |
| Total | 24.8% | 30.6% | 24.2% | 14.1% | 6.2% |
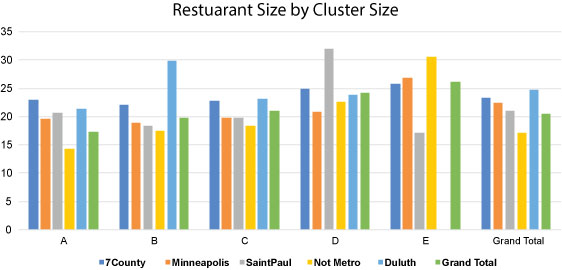
There's not a lot of size of restaurant variability across geographies of clusters. Duluth and metro restaurants have the highest employment, Minneapolis and Saint Paul have average numbers of employers, and non-metro areas are smallest. Large clusters tend to have slightly larger restaurants. However, employees are not necessarily a good measure of size. The number of employees is the total number of individuals who received a paycheck from the company – non-urban areas may have more full-time workers and therefore serve the same number of customers with fewer overall employees.
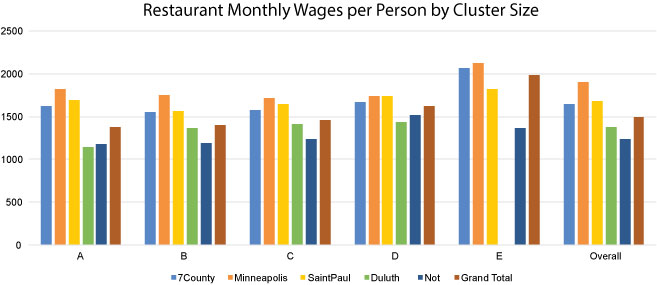
Wages are highest in the Twin Cities and in large clusters. Since this is total payroll divided by number of workers, that's a pretty good sign that bigger is more prosperous.
Brewery wages are higher in all regions and more consistent between regions. Manufacturing in general pays better than food service, so this may reflect the employees primarily involved in brewing rather than the wages paid to servers at this kind of establishment. Bars and coffee shops pay the worst, but bars have much greater regional variation in pay, with Twin Cities workers earning more. This might have something to do with tip reporting. Full service pays well (tips), as do buffets.
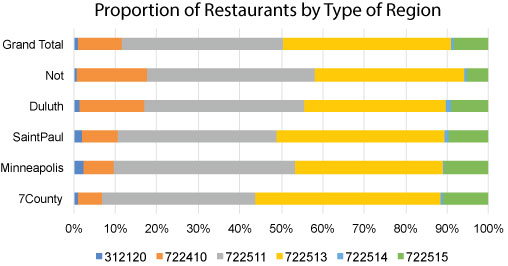
Limited-service is primarily metro. Bars are more prevalent outside the metro, probably because there are fewer location restrictions. Minneapolis has the most full-service restaurants while suburbs have the least. The proportions are reversed for limited-service restaurants. For both types Saint Paul is in line with the state total. Cafeterias/buffets are rare and snack bars are suburban.
Breweries (312120) are relatively uncommon but mostly exist in cities Minneapolis, Saint Paul, and Duluth. Bars (722410) are most common outside cities but are more common in big cities than in suburbs, particularly Duluth. Full-service restaurants (722511) are rural and in Minneapolis although Duluth is trying to catch up. Saint Paul wins limited-service (722513) with the suburbs following closely. Cafeterias (722514) are uncommon but more common in Duluth. Snack Bars (722515) are evenly distributed in populated non-rural areas.
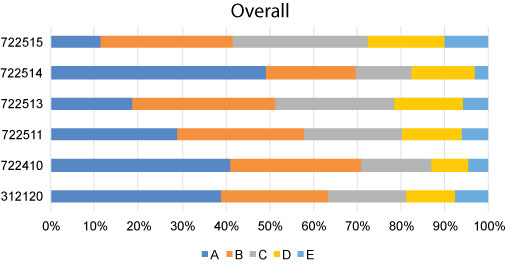
Cafeterias/buffets are most likely to be alone or in small clusters, followed by bars, which are more likely than cafeterias to be in small or mid-sized clusters. Snack bars and breweries are most likely to be in large clusters, but snack bars more so, probably thanks to their prevalence in malls.
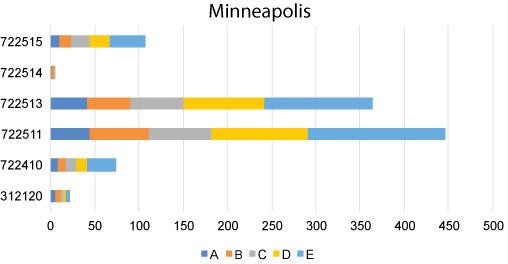
Minneapolis has by far the greatest share of employment in large clusters, probably because it has two and most other areas do not. The types of establishments in those large clusters are numerically mostly full and limited service restaurants but proportionally Bars and Snack Bars are over-represented.
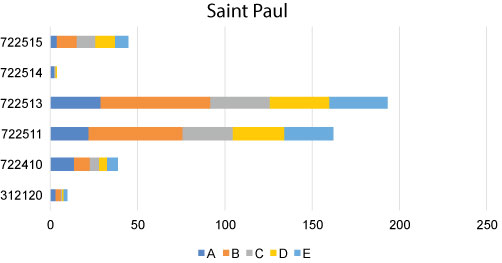
St. Paul has many small clusters, and proportionally more limited-service restaurants. Bars are more likely to be in neighborhoods with a larger share in small clusters.
Rural non-metro areas have significantly more bars than cities and nearly half stand alone away from other eating establishments. Nearly 40 percent of full-service restaurants are also outside clusters.
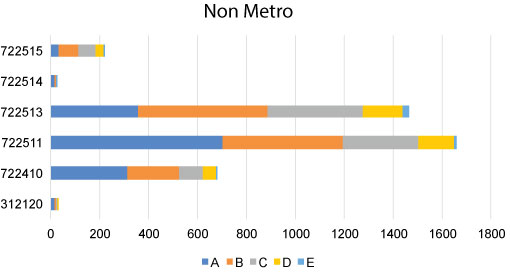
Although Duluth doesn't have any truly large clusters, a larger proportion of its eating establishments across all types are located in its largest clusters. Duluth's share of bars is more like non-metro areas, but their locations tend to be in clusters more like the largest cities. All of Duluth's breweries are in mid-sized clusters, suggesting that they are truly social rather than industrial establishments.
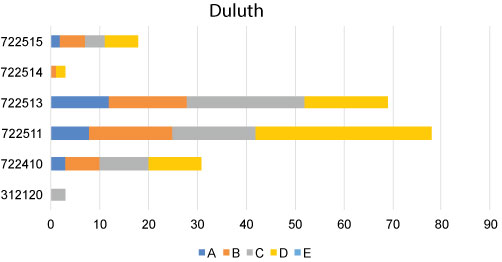
Minneapolis' downtown is unique in the state, but Duluth is similarly polarized in terms of having a few massive commercial districts and then restaurant-desolate residential areas. Saint Paul is much more likely to have lonely neighborhood restaurants, a pattern that's similar to the suburbs, but much denser overall.
Restaurant clusters in many parts of the state are really more like heavily commercial streets – thoroughfares with businesses alongside residential areas. Perhaps this is a result of zoning or street configuration.