by Chet Bodin
December 2016
Discussion surrounding the millennial generation is widespread and multi-faceted, largely because it is set to become the largest segment of Minnesota's workforce in the next decade. But what makes millennial impact even more important to employers, policy-makers, and educational institutions is the context of their arrival. Even as millennials enter the labor force in droves, the previous generation to dominate the workforce, the baby boomers, are exiting even faster. Consequently, not only are values and norms in the workplace changing, but the ensuing workforce shortage has created a simultaneous challenge. By 2025 both metro and rural areas alike will be facing at best a plateau in labor force growth like never before (see Table 1). Many areas will see their labor forces shrink. The ability of local employers to withstand a shortage will depend on where millennials chose to plant their roots and the extent to which communities prioritizes their livelihood.
| Table 1. Labor Force Projections, 2015-2025 | ||||
|---|---|---|---|---|
| Planning Area | 2015 | 2025 | 2015-2025 Change | |
| Labor Force Projection | Labor Force Projection | Numeric | Percent | |
| Central MN | 402,204 | 418,831 | 16,627 | 4.10% |
| Northwest MN | 293,520 | 288,888 | -4,632 | -1.60% |
| Northeast MN | 163,514 | 153,806 | -9708 | -5.90% |
| Southeast MN | 279,963 | 282,768 | 2,804 | 1.00% |
| Southwest MN | 218,045 | 217,428 | -617 | -0.30% |
| Twin Cities Metro | 1,647,550 | 1,668,839 | 21,289 | 1.30% |
| Minnesota | 3,004,113 | 3,027,364 | 23,251 | 0.80% |
| Source: calculated from Minnesota State Demographic Center population projections and 2011-2015 American Community Survey 5-Year Estimates | ||||
In Minnesota the supply of millennial workers varies by region, and whether an employer is looking to attract more or live without them, their relative size in the workforce and mobility patterns matter. These sizable demographic shifts are leading employers to examine generational context in their management and hiring strategies more and more.
Generational identity is often based more on social acceptance than definite timelines, and specific boundaries of the millennial generation remain somewhat unsettled. If for no other reason, demographic starting and ending points need to be established to provide macro-level quantitative analysis. Most efforts to pin down the boundaries of the millennial generation range between 1977 and 2002, but both the floor and ceiling vary.
The generational boundaries for this analysis are set parallel to the data sources utilized. In 2015 estimates from the American Community Survey (ACS), millennials would have been between the ages of 13 and 38 at the widest range. ACS population estimates, however, are organized by five-year age groups (i.e., 0-4 years, 5-9 years, etc.), and trend analysis benefits from age ranges that follow suit. The youngest age limit can easily be increased to 15 since most people do not enter the workforce until at least that age anyway. In addition, most estimates of the millennial generation do not exceed 20 years in length, which would put the upper age limit at 34 years of age in 2015. By that estimation, millennials researched here would have been born from 1981 to 2000.
Based on this, the millennial generation – people between 15 and 34 years of age in 2015 – accounted for more than a quarter of Minnesota's statewide population. As they come of age, millennials will have a significant impact on Minnesota's culture, economic demands, and workforce supply. However, the extent of millennial influence varies by region and will continue to change over time. Population projections from the Minnesota State Demographer's Office estimate that millennials will hold a shrinking share of the state's population over the next two decades. Twenty-somethings often migrate away from their home towns for other opportunities, particularly young adults who originate from rural areas.
| Table 2. 2015-2035 Millennial Population Projections | ||||||
|---|---|---|---|---|---|---|
| 2015 | 2025 | 2035 | ||||
| Number | Percent | Number | Percent | Number | Percent | |
| Northwest | 143,349 | 24.7% | 131,018 | 21.6% | 130,720 | 21.1% |
| Northeast | 83,370 | 25.1% | 69,245 | 20.5% | 69,106 | 20.8% |
| Central | 196,499 | 26.6% | 185,623 | 23.1% | 185,465 | 21.7% |
| 7-County Metro | 785,528 | 26.8% | 758,154 | 24.2% | 742,590 | 22.6% |
| Southeast | 134,667 | 26.2% | 125,800 | 23.0% | 124,426 | 21.8% |
| Southwest | 107,494 | 26.8% | 91,424 | 22.0% | 89,889 | 21.2% |
| Minnesota | 1,450,907 | 26.4% | 1,361,264 | 23.3% | 1,342,196 | 22.0% |
| Source: MN State Demographer's Office | ||||||
In Greater Minnesota the southwest region is projected to have the most millennial out-migration from 2015-2035 and the fastest population decline overall (see Table 2). Future migration patterns may be the contributing factor to actual outcomes, as many millennials are still in high school and have yet to decide whether they will leave their home towns.
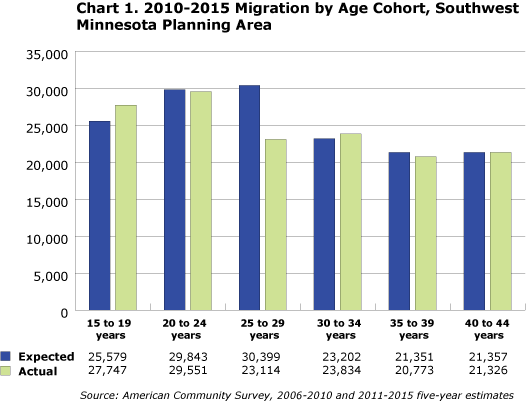
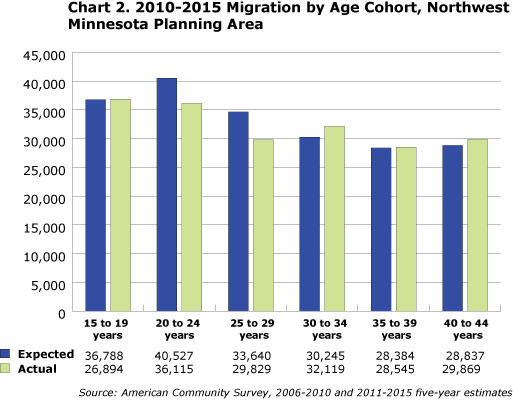
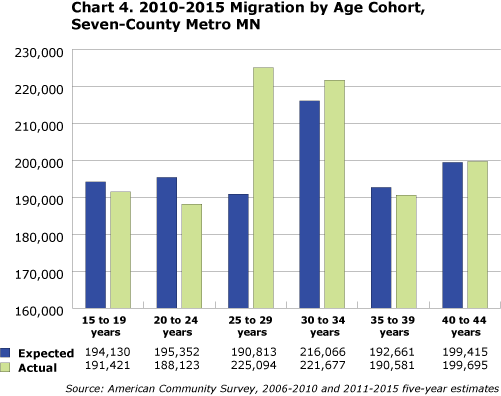
A Simplified Cohort Analysis helps demonstrate how age groups shift over time: people who were in the 15 to 19 year old age group in 2010 will be in the 20 to 24 group in 2015. If no one moves in and no one moves out, the count of people in that age group in 2010 would provide an "Expected" count of people in the next age group in the next five year time period. However, "Actual" numbers are oftentimes different, showing in- or out-migration.
For example, a large portion of the millennial generation aged into their 20s from 2010 to 2015, and over 7,500 more of these 20-somethings vacated Southwest Minnesota than moved in (see Chart 1). Based on the population projections in Table 1, it appears millennial out-migration will continue as those who are teenagers now begin to test other markets from 2015-2025.


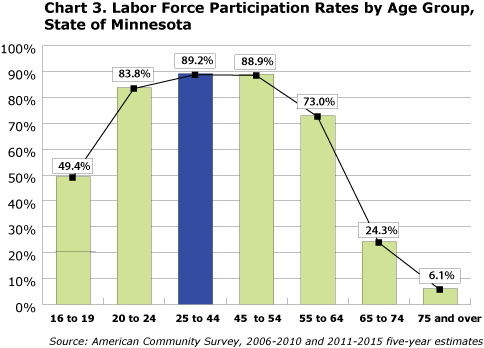
While the number of millennials in Greater Minnesota is likely to decline in the next decade, their impact in the regional workforce may still increase. Throughout Minnesota the labor force participation of millennials is likely to increase when the entire generation comes of age. Historically, the highest labor force participation rates are among those 25 to 44 years of age – the approximate age of millennials in Minnesota by 2025 (see Chart 3).


Like migration patterns, labor force participation rates also vary by region. For example, teenagers tend to have higher labor force participation rates in Greater Minnesota than in the seven-county Metro Area. The number of millennials in a regional labor force varies by their population and participation rate, but the proportion of the labor force they encapsulate also depends on the activity of other age groups. In Northeast Minnesota the labor force participation rate of those 25 to 44 years of age was nearly 24 percent higher than those 54 to 65. Naturally then, the proportion of millennials in the regional workforce will grow, even as their numbers decrease overall. Indeed, the proportion of millennials in the Northeast labor force is projected to grow by over 4 percent by 2035 (see Table 3).
| Table 3. 2015-2035 Labor Force Projections by Region, Minnesota | ||||||
|---|---|---|---|---|---|---|
| - | 2015 | 2025 | 2035 | |||
| Millennial Labor Force | Percent of Total | Millennial Labor Force | Percent of Total | Millennial Labor Force | Percent of Total | |
| Northwest | 103,808 | 35.4% | 114,772 | 39.7% | 113,629 | 40.0% |
| Northeast | 58,243 | 35.6% | 58,235 | 37.9% | 57,631 | 39.9% |
| Central | 157,394 | 39.1% | 163,163 | 39.0% | 163,292 | 39.0% |
| Southwest | 79,326 | 36.4% | 81,276 | 37.4% | 79,429 | 37.5% |
| Southeast | 100,596 | 35.9% | 110,201 | 39.0% | 109,789 | 39.0% |
| 7-county metro | 582,929 | 35.4% | 670,966 | 40.2% | 652,695 | 39.6% |
| Source: MN State Demographer, ACS 2011-2015 five-year estimates | ||||||
The percent of millennials is projected to increase in almost every regional labor force of nearly every region of Minnesota by 2025. The only exception, Central Minnesota, currently has the highest percentage of millennials in its workforce, and, despite a slight decrease in the proportion of millennials projected there in 2025, the number of working millennials is likely to increase by more than 5,000 in that time (see Table 3).
The labor force in the seven-county Metro Area is set to have the largest infusion of millennials workers over the next 10 years. Close to 90,000 more millennial workers are projected to inhabit the metro by 2025, the result of heavy metro-migration by those in their late 20s (see Chart 3). From 2010-2015 there were 18 percent more 25-29 years olds than expected, trending in stark contrast with the migration patterns of 25 to 29 years olds in every other region of the state. By 2025 the youngest millennials will fall into this age category.
The migration patterns of the oldest millennials, who will be in their early forties by 2025, will also have significant effects on the composition of regional labor markets. To varying degrees, every region of the state attracts more people ages 30 to 34 than they lose, but the same cannot be said about age groups 35 to 39 and 40 to 44. From 2010-2015 Northwest Minnesota was the only region to attract more people from both of these age groups than it lost. Based on current trends, millennials in Northwest Minnesota's labor force are projected to account for almost 40 percent by 2025 (see Table 3).
What may be equally important to future migration patterns, however, is the qualitative nature of the millennial generation in the workplace, and whether parts of Greater Minnesota have the cultural flexibility to accommodate the new economic and technological norms millennials practice. After all, most migration to Greater Minnesota regions generates from the metro area, and millennials may not be as eager to move in their 30s and 40s as others are today. Fortunately, employers throughout Minnesota still have time to prepare for possible changes or even influence labor force trends. Cultural differences notwithstanding, the potential for a labor force shortage in the near future has employers looking to maximize their talent and attract workers. Employers who chooses not to upgrade their technological capabilities or stay competitive with their wages will have a hard time accomplishing either. But just as important may be the influence industry leaders have on local culture – creating communities that millennials are excited to be a part of can have a major impact. As the numbers indicate, there will be real opportunities to generate mobility to rural parts of Minnesota over the next 10-20 years.