by Dave Senf
August 2017
Note: All data except for Minnesota’s PMI have been seasonally adjusted. See the feature article in the Minnesota Employment Review, May 2010, for more information on the Minnesota Index.
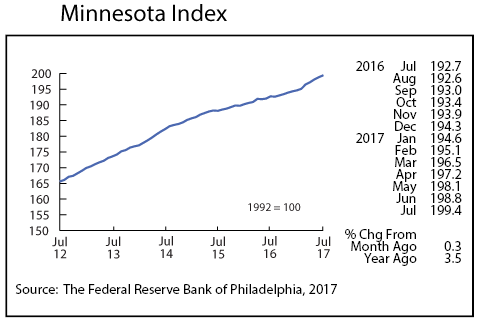
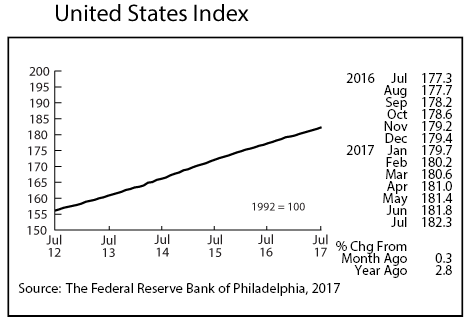
The Minnesota Index advanced 0.3 percent for the second month in a row in July as wage and salary employment and average weekly manufacturing hours increased while the unemployment rate remained steady at 3.7 percent. The U.S. index also advance 0.3 percent, ending a four month stretch where Minnesota’s index grew faster than the U.S. index.
Minnesota’s index is up 3.5 percent over the year, bettering the U.S. over-the-year increase of 2.8 percent. Minnesota’s index through the first seven months of the year is up 2.6 percent which is a huge improvement over the 1.6 and 1.5 percent recorded during the first seven months in 2015 and 2016. The strong showing by the Minnesota Index during the first seven months of the year is a compelling indicator that Minnesota’s economy has shifted into a higher gear in 2017.
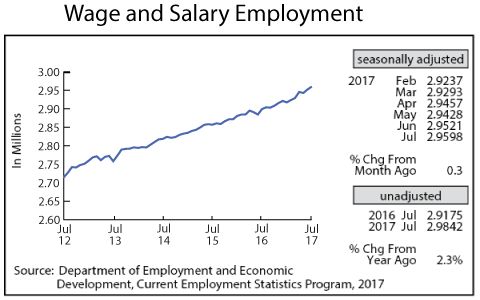
Minnesota’s adjusted Wage and Salary Employment recorded another stellar month of job creation with 7,700 jobs added. All job growth was in the service-providing sector as goods-producing jobs were down by 200. Educational and Health Services was the main driver of job growth in July, adding a record one month gain of 8,400. Leisure and Hospitality and Government also hired heavily last month. Job cuts were highest in Professional and Business Services and in Financial Activities.
Minnesota’s unadjusted over-the-year job growth tailed off to 2.3 percent but remains elevated from the 2011 – 2016 average of 1.6. Minnesota’s job growth rate continues to surpass the nationwide rate which was 1.5 percent in July. Right now it looks like Minnesota’s job growth rate for all of 2017 will top the U.S. rate which hasn’t happened since 2012. Wage and salary employment in the state also surpassed Wisconsin’s total for the second straight month. June and July mark the first time that Minnesota’s payroll employment has topped Wisconsin’s. Minnesota passed Wisconsin in Gross State Product in 1984 and personal income in 2004, and now in payroll employment.
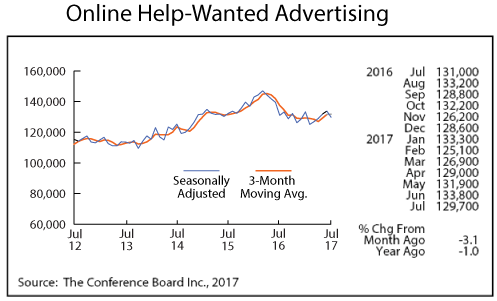
Online Help-Wanted Ads dipped for the first time in three months, dropping to 129,700 in July. July’s 3.1 percent dip was slightly lower than the national 3.3 percent dip. Job postings in Minnesota have averaged roughly 130,000 over the last 12 months so July’s level indicates that demand for workers by Minnesota employers remains strong. Minnesota’s share of national online job advertising held steady at 2.8 percent for the second month in a row.
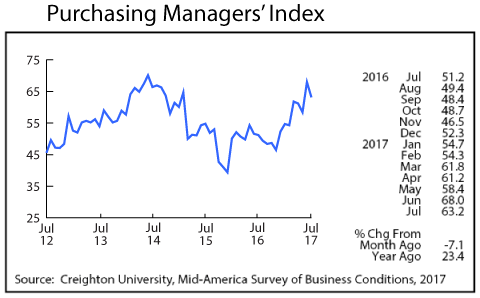
Minnesota’s Purchasing Managers’ Index (PMI) slipped from its very robust 68 reading in June to a still strong 62.3 in July. The average reading for the 23-year PMI is 53.9, so July’s strong reading is another indicator that Minnesota’s economy has picked up speed in 2017. The corresponding national index fell to 56.3 while the Mid-American index slipped to 56.1. The employment component of Minnesota’s index continued to run positive, topping 60 for the fifth straight month and indicating that manufacturing payrolls are likely to continue to expand over the next few months.
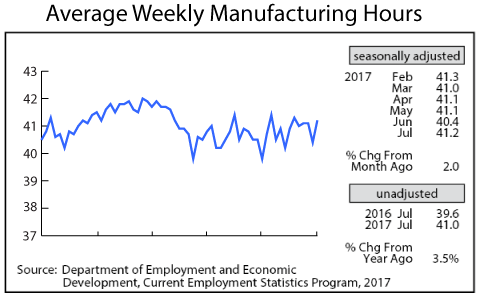
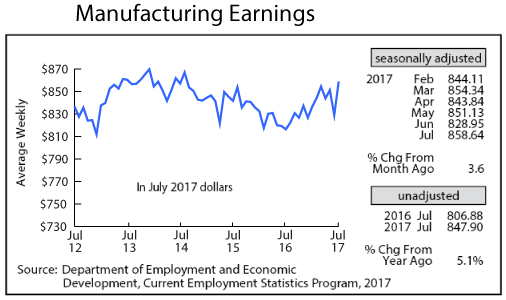
Adjusted Manufacturing Hours rebounded sharply in July to 41.2 hours, the highest since February. Average weekly Manufacturing Earnings also rebounded, jumping to $854.64. July’s factory paycheck was the largest since August 2014. Higher manufacturing hours and earnings is consistent with other indicators, pointing towards an uptick in manufacturing activity in Minnesota over the next six month.
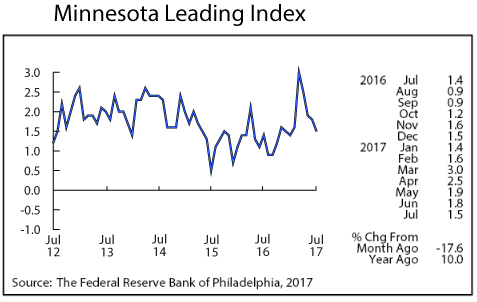
The Minnesota Leading Index retreated for the fourth consecutive month in July to 1.5. July’s reading is the lowest since January but still predicts solid growth through the rest of the year. Minnesota’s leading index has been higher than the U.S. leading index since February which means that since February, Minnesota’s economy was expected to outpace national growth over the next six months. July’s reading again suggests that Minnesota’s economic growth over the next six months will be stronger than nationwide growth.
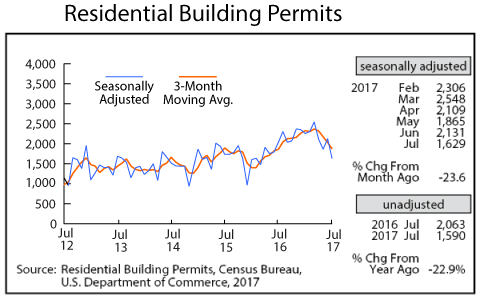
Adjusted Residential Building Permits surprised on the downside in July, dropping to the lowest monthly level in 17 months. A drop-off in multifamily units building permits is behind most of the unexpected decline. July’s 1,629 total indicates that home builders may be pulling back slightly over the next year.
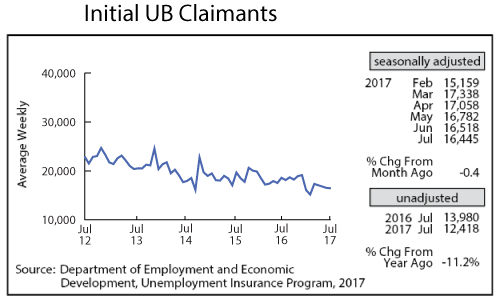
Adjusted Initial Claims for Unemployment Benefits (UB) inched down for the fourth month in a row to 16,455. Unadjusted initial claims were 11.5 percent lower than a year ago. Initial claims are running roughly 9 percent below the 2016 level. The low level of initial claims is another indicator that corroborates a strong labor market. Unemployment is likely to inch down for the rest of the year.
