by Dave Senf
February 2013
Note: All data except for Minnesota's PMI have been seasonally adjusted. See the feature article in the Minnesota Employment Review, May 2010, for more information on the Minnesota Index.
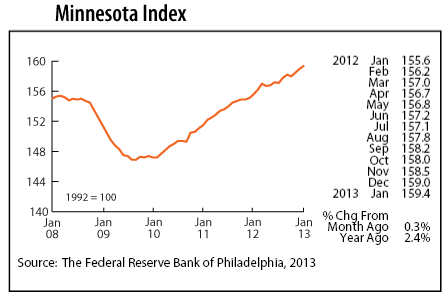
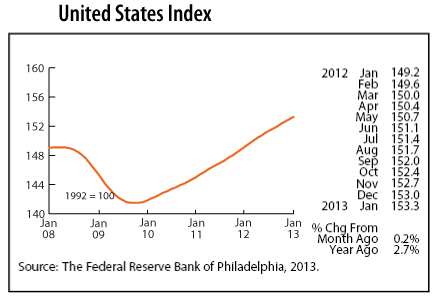
The Minnesota Index advanced for the third straight month in January, repeating the 0.3 percent increase posted in each of the previous two months. The index, revised this month to incorporate the annual benchmarked employment data, was up 2.5 percent between December 2011 and December 2012. The index is a monthly proxy for the state's GDP, so the 2.5 percent increase last year is an early estimate of the state's GDP growth in 2012. Last year's economic growth fell just a tad below the 2.6 percent growth in 2011.
The U.S. index increased for the 39th consecutive month, climbing 0.2 percent. Minnesota's economy has expanded faster than the U.S. economy over the last three months. Minnesota's index hasn't run ahead of the U.S. index for three consecutive months since the first three months of 2012. Steady job growth in Minnesota has kept the index headed upward over the last few months.
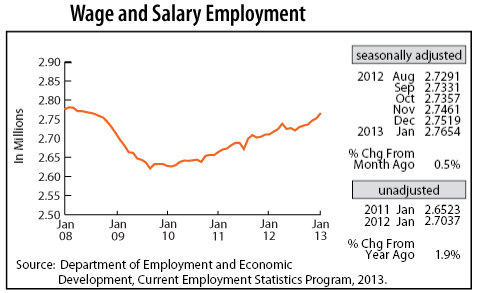
Minnesota's Wage and Salary Employment spiked in January with payroll numbers increasing 13,500. January's 0.5 percent jump was the strongest since last April. Job growth was broad based with all super sectors except financial activities adding jobs. Job growth hasn't been recorded across this many sectors since August 2011. Private sector job growth was positive for the ninth straight month. Hiring was robust in trade, transportation, and utilities, in construction, in leisure and hospitality, and in government.
Minnesota's over-the-year job growth, based on unadjusted job numbers, was 1.9 percent in January. Benchmarked job data now shows that annual average job growth in 2012 was down from 2011, 1.4 percent versus 1.8 percent. Last year's job growth is likely to be revised upward next February when April through December 2012 job data are benchmarked for the final time.
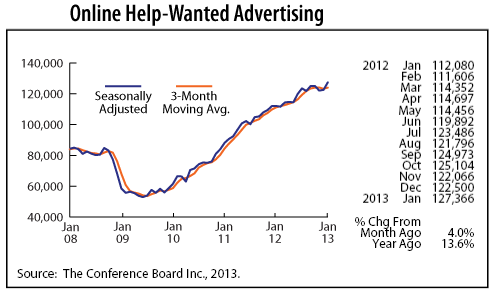
Minnesota's adjusted online Help-Wanted Ads which had been showing signs of slipping during the second half of 2012 were revised in January. Online job advertising, as reported by Conference Board, Inc., now shows that labor demand remained strong during the last six months. January's 4.0 percent increase was the highest jump since last June. Minnesota's share of national online help-wanted ads continues to run around 2.5 percent, suggesting that labor demand is stronger than nationally since Minnesota's share of national wage and salary employment is around 2.0 percent.
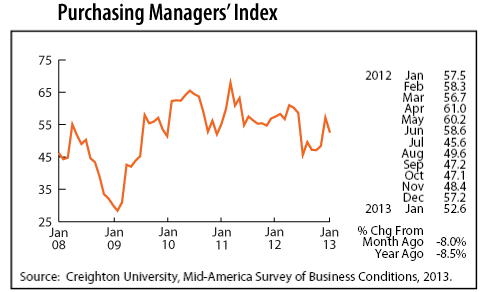
Minnesota's Purchasing Managers' Index (PMI) retreated in January after rebounding during the previous two months. January's 52.6 reading, however, is above the growth neutral 50 and suggests that Minnesota's manufacturing sector will continue to expand during the first half of 2013. The five-month string of sub-50 readings in the second half of last year seems to have been a false indicator of troubles ahead for Minnesota's economy. Manufacturing may have downshifted to a lower gear toward the end of 2012 but other sectors picked up Minnesota's economy.
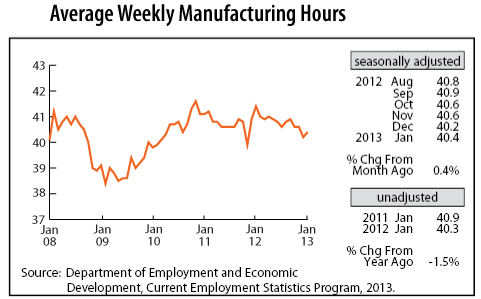
Adjusted Manufacturing Hours rebounded slightly in January after having been on a five-month downward trend. The uptick in factory hours may be a sign that Minnesota's manufacturers have started to regain some traction after slowing down in late 2012
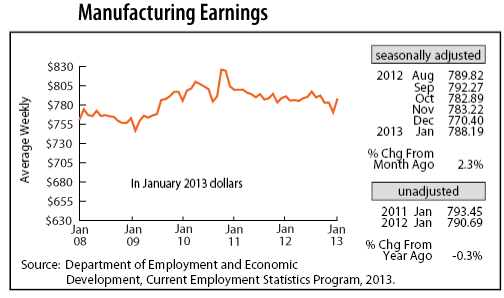
Adjusted Manufacturing Earnings jumped 2.3 percent to $788.19, the largest one-month increase since October 2010. Factory paychecks, adjusted for inflation, are still lower than a year ago. Longer factory workweeks and higher paychecks in the near future would be a good indicator that the state's manufacturers were accelerating production.
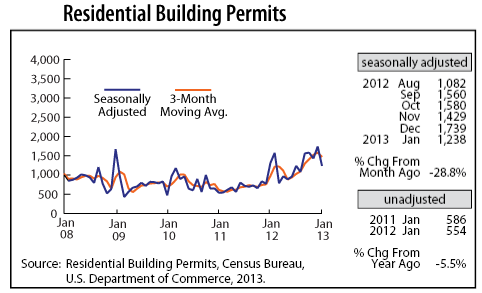
Adjusted Residential Building Permits tumbled in January, but the decline is expected to be temporary as most housing related indicators point toward a budding housing recovery. Solid job growth in 2013 will help boost the rebound in home building which will accelerate construction hiring.
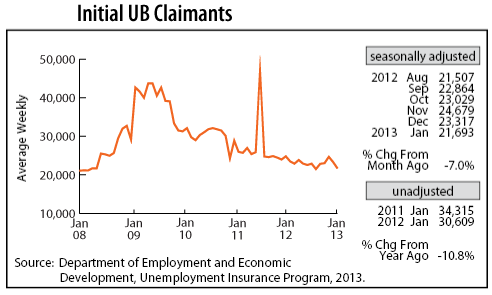
After drifting upward over the previous three months, adjusted Initial Claims for Unemployment Benefits (UB) dipped for the second month in a row in January. Unadjusted claim numbers are down 10.8 percent from a year ago, indicating that the layoff rate continues to wane.