by Dave Senf
April 2019
Note: All data except for Minnesota’s PMI have been seasonally adjusted. See the feature article in the Minnesota Employment Review, May 2010, for more information on the Minnesota Index.
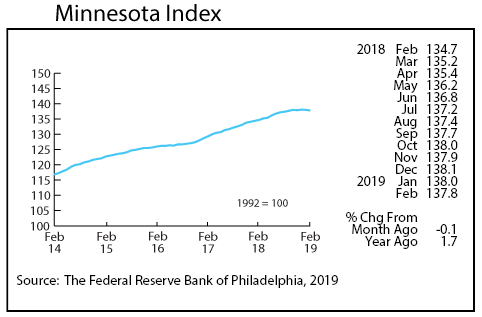
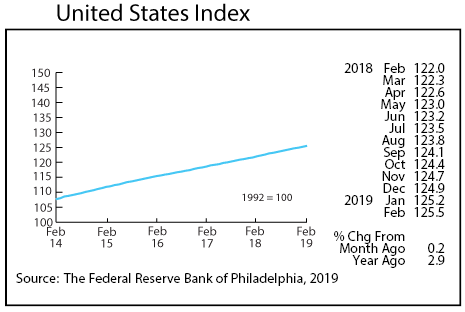
The Minnesota Index dipped for the fourth time over the last five months in March, slipping to 137.6. While wage and salary employment inched up, average weekly manufacturing hours declined, and the unemployment rate rose for the third straight month. The U.S. index increased 0.2 percent for the fourth month in a row, reaching 125.8.
March’s reading was up over the year 1.7 percent for Minnesota and 2.9 percent for the U.S. The 1.7 gain was the smallest for the state since November 2016. The Minnesota Index, after averaging a 3.9 percent over-the-year increase in 2018, averaged only a 2.2 percent increase during the first three months. The pace of economic growth in Minnesota has slowed noticeable over the last six months. Seven other states recorded declining economic activity in March with Kansas stumbling the most followed by Hawaii, Maryland, and then Minnesota.
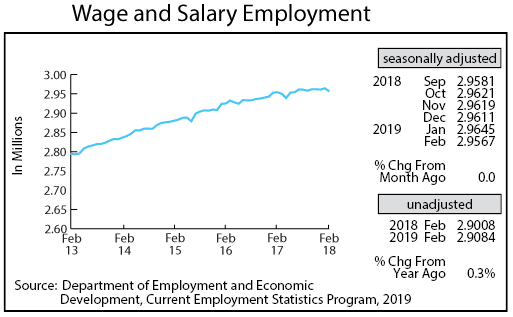
Minnesota adjusted Wage and Salary Employment recorded a weak rebound in March, inching up 1,300 jobs after cutting 7,800 in February. All the jobs added were in the private sector as public sector payroll numbers were down 100. Construction employment, after dropping by 3,500 the previous month, added 2,900 jobs in March. Manufacturing lost jobs for the third month in a row. Six sectors boosted employment while seven sectors reduced their workforce.
Unadjusted over-the-year job growth ticked up to 0.3 percent. That gain is down from the 0.7 percent average in 2018 and below the 1.7 percent rate for the U.S. in March. Labor demand, as evidenced by the level of job openings, remains robust, and layoff rates, as supported by low initial unemployment claims, continue at record-low levels.
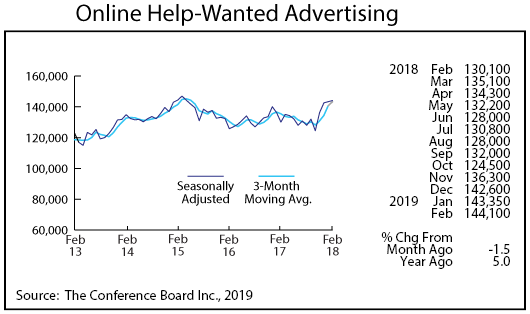
Online Help-Wanted Ads tailed off in March to 141,900 but remain high by historic standards. Online postings fell 1.5 percent in Minnesota and 2.1 percent across the U.S. in March. Minnesota’s share of online postings rose to 2.7 percent. Robust job listings in other states have drawn more people into the labor force, allowing solid hiring activity. Minnesota’s pool of workers on the sideline has already been used up over the last few years which is limiting the hiring pace in Minnesota.
Minnesota’s U-6 unemployment rate averaged 5.4 percent in 2018. The U-6 unemployment rate is the broadest measure of labor market slack as it includes marginally attached, discouraged, and involuntary part-time workers. Only Iowa and North Dakota had a lower U-6 rate in 2018. New Hampshire, Nebraska, South Dakota, and Vermont also had U-6 rates below 6.0 percent. The combined over-the-year job growth rates for these seven states in March was 0.6 percent compared to the 1.7 nationally. Job growth in Minnesota and the other states listed here have slowed as a result of very tight labor markets.
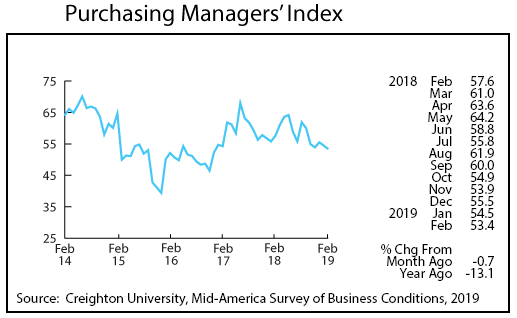
Minnesota’s Purchasing Managers’ Index (PMI) stumbled for the third month in a row to 53.0, the lowest reading in over two years. Minnesota’s PMI continues to report in two comparable indices. The Mid-America Business Index climbed for the fourth consecutive month to 58.2 while the national PMI advanced to 55.3.
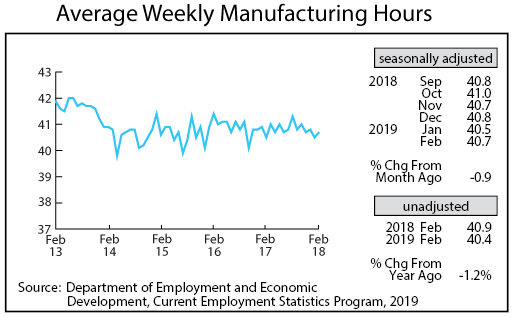
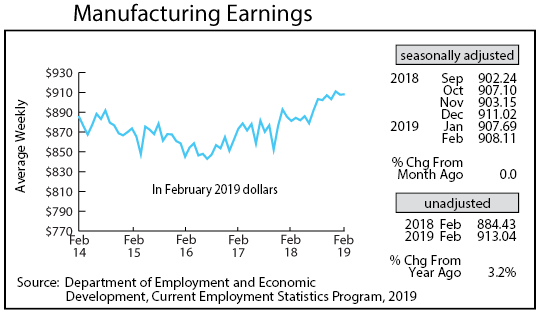
Adjusted average weekly Manufacturing Hours dropped noticeably in March to 40.3 hours, a 17-month low. The decline is consistent with other signals of slowing manufacturing activity in the state. Average weekly Manufacturing Earnings, adjusted for inflation and seasonality, inched up for the second straight month to $908.34 in March. Real manufacturing paychecks averaged 2.4 percent higher than the year before since the start of 2017.
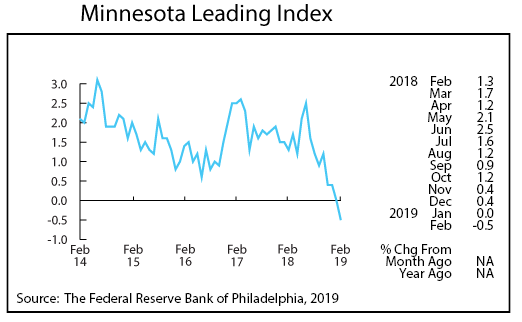
The Minnesota Leading Index for March will be published during the first week in May, but February’s recently published leading index predicts that Minnesota’s economy will continue to face headwinds. February’s reading of -0.5 is the lowest since April 2009. Minnesota has the unpleasant distinction of being one of six states with negative leading indices in February. The U.S. index was 1.1 in February, its lowest reading.
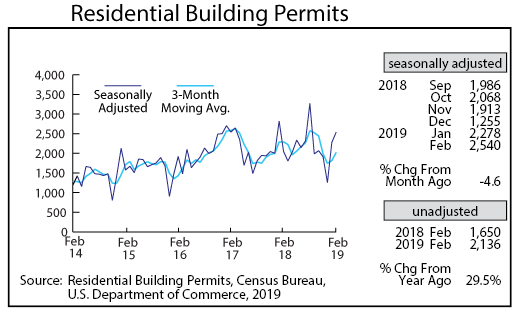
Adjusted Residential Building Permits remain one of the few positive indicators for Minnesota’s economy as permit numbers inched down slightly in March to 2,424 but remained well above the 39-year average of 2,100. Home-building permits through the first three months of 2019 are 10.2 percent higher than 2018 and the second highest level first quarter total since 2006.
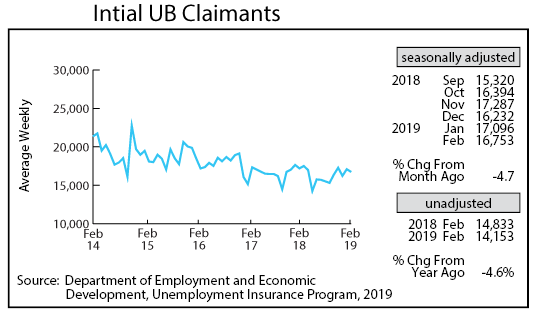
Adjusted Initial Claims for Unemployment Benefits (UB) fell for the second straight month to 15,961 in March. Employers continue to keep layoffs to a minimum in light of hiring difficulties and solid business conditions.