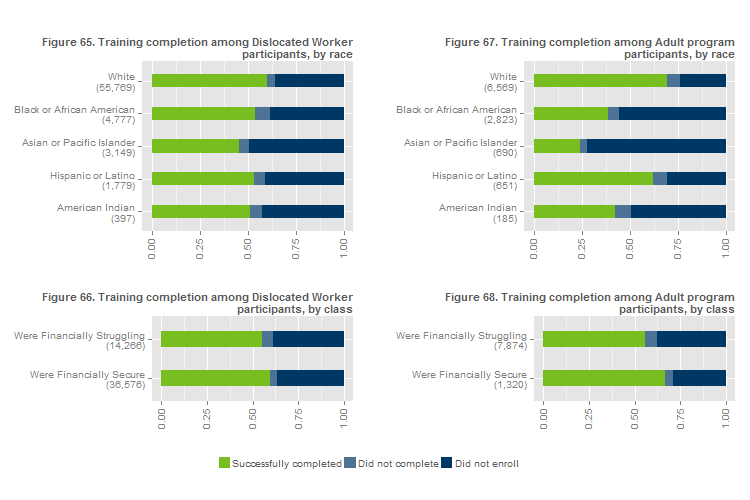
Figures 65 through 68 show rates of any training completion, from credentialed training in an occupation in demand to on-the-job training or non-credentialed training (not previously shown). (See Note 1).

Rates of any training completion among Dislocated Worker participants range from a high of 60% among white participants to a low of 45% among Asian or Pacific Islander participants (Figure 65). The difference is smaller by class: 59% of participants who were financially secure prior to participation completed any type of training, compared to 55% of those who were financially struggling (Figure 66).
Here again, disparities in training completion rates are much more pronounced among Adult program participants. Nearly 70% of white participants completed any type of training, compared to 24% of Asian and Pacific Islander participants (Figure 67). Again, the difference by class is smaller: 67% of those who were financially secure prior to participation completed any type of training, compared to 55% of those who were financially struggling.