
by Alessia Leibert
March 2018
Earning a two- or four-year college degree pays off with higher earnings for most students. Even students who ultimately don't graduate are likely to see a wage premium, depending on how long they stay in school and what they study.
Students who attend postsecondary school bring important skills to the workforce even when they do not achieve a credential. Unfortunately, standard labor market outcome metrics overlook students who do not graduate. The purpose of this study is to look at all students who participated in postsecondary education in Minnesota in order to measure the advantages of attending college and attaining credentials versus stopping after high school.
In particular, we'll examine the following research questions:
This study is based on the entire population of new undergraduate students enrolled in a postsecondary school in Minnesota from July 2005 to June 2015. Out of 450,623 people, 38.5 percent left school without earning a credential, while the remaining 61.5 percent graduated (Table 1).
| Table 1. Educational Outcomes by Demographic and College Attendance Characteristics | |||
|---|---|---|---|
| Student Characteristics | Number | Educational Outcomes, Completers | Educational Outcomes, Non-completers |
| Total | 450,623 | 61.5% | 38.5% |
| Demographics | |||
| Female | 242,538 | 62.8% | 35.0% |
| Male | 208,001 | 55.4% | 42.9% |
| Enrolled at Age<=28 | 388,042 | 63.0% | 37.0% |
| Enrolled at Age>28 | 62,581 | 52.0% | 48.0% |
| White, not Hispanic | 351,857 | 65.3% | 34.7% |
| Black | 35,192 | 38.4% | 61.6% |
| Asian* | 21,674 | 58.9% | 41.1% |
| American Indian | 5,999 | 33.4% | 66.6% |
| Hispanic | 15,152 | 50.9% | 49.1% |
| Mixed race | 10,454 | 54.9% | 45.1% |
| Race not reported | 10,295 | 54.9% | 45.1% |
| College Attendance Characteristics | |||
| Enrolled From 2006 to 2010 | 173,186 | 53.4% | 46.6% |
| Enrolled After 2010 (post-recession) | 277,437 | 66.5% | 33.5% |
| Initially Enrolled in a Two-Year Institution (Public or Private) | 278,909 | 49.9% | 50.1% |
| Not Initially Enrolled in a Two-Year Institution | 171,714 | 80.2% | 19.8% |
| Took Remedial Education Credits | 136,489 | 45.4% | 54.6% |
| Never Enrolled in Remedial Credits | 314,134 | 68.4% | 31.6% |
| Attended Full-Time** on Average in Fall Semester | 265,256 | 70.1% | 29.9% |
| Attended Part-Time on Average in Fall Semester | 185,367 | 49.1% | 50.9% |
| *This group includes 448 Native Hawaiian and Other Pacific islanders.
**Full-time enrollment is defined as enrolled for 12 or more credits per semester during the academic year. Source: Statewide Longitudinal Education Data System and DEED wage record data. See "About the data" for additional detail. |
|||
This figure is not comparable to official graduation rates, which are generally based on strict time-to-completion criteria, such as six years to finish a bachelor's degree. These conventional criteria tend to treat students who enroll part time or discontinuously as dropouts, when some of them actually finish in the longer term. Our definition gives the 2006 cohort 10 years to graduate (until June 20151), the 2007 cohort nine years, and so on.
Using this definition of graduation rates, we can compare the characteristics of students who completed with those who did not, with the aim of identifying factors commonly associated with a student's chance of finishing college.
The importance of each characteristic is discussed below.
Gender: Women were more likely to complete than men. This difference is partially attributable to the types of majors pursued by women, as will be explained later in the article.
Age: Overall, only a small minority of students initially enrolled after age 28. Half of them (52 percent) completed a credential versus 63 percent among those who enrolled at a younger age. Delaying college entry is associated with a lower likelihood of completing, for two main reasons. First, earning a formal credential may not be a meaningful milestone for many adult workers, such as midcareer professionals whose main purpose is to upgrade their skills. Second, older laid-off workers in need of retraining might have left school for work as soon as they had a chance.
Cohort of enrollment: The likelihood of not completing was higher for students who first enrolled before 2011, despite the fact that they had more years to complete their studies than those who enrolled after. This result is probably explained by the larger influx of nontraditional students in higher education during the Great Recession (2007 to 2010).
Race: While students of black, Latino and American Indian background account for only 12.5 percent of enrollments, they tend to leave school without a credential at much higher rates than their white and Asian peers. The highest dropout rate is among American Indians (66.6 percent) followed by blacks and Hispanics/Latinos (61.6 and 49.1 percent, respectively). Completion rates have improved since 2011 across racial groups, but racial disparities persist.
School type: Students who started college at two-year institutions were less likely to earn a credential than students who enrolled directly at four-year institutions (49.9 percent versus 80.2 percent). This result is probably driven by the socio-economic characteristics and the educational goals of students who enroll in two-year schools. Community colleges and private career schools are less restrictive in terms of admissions and offer shorter programs that fit the needs of students who are not interested in a four-year degree. Public colleges have the additional advantage of being more affordable2 for students of disadvantaged backgrounds who otherwise would be unable to access postsecondary education.
Enrollment status: Only half (49.1 percent) of part-time enrollees graduated compared with 70.1 percent of full-time enrollees. Part-time enrollees typically work while in school and struggle more to keep up with coursework.
Placement in remedial courses: Thirty percent (136,489) of students who entered higher education were required to take remedial courses in math, reading or writing. Less than half (45.4 percent) of students who enrolled in any amount of remedial courses completed a credential compared with 68.4 percent among those who never enrolled in remedial education. Having to take remedial courses typically increases the time needed to graduate because remedial credits do not count toward graduation and often use up financial aid.3 The need for remediation, however, is influenced by factors that can develop long before a student enters college, such as academic preparedness and poverty. These factors will be reviewed later in the article. For now it will suffice to point out that placement in remediation is extremely racially unbalanced. Only 26.5 percent of white students enrolled in remedial credits compared with blacks at 54.2 percent, American Indians at 42.1 percent, Hispanics/Latinos at 42.7 percent, and Asians at 40.2 percent.
Demographic characteristics – especially race – are key determinants of educational attainment, but student attendance behavior also matters. Gathering better information on what factors influence attendance can help higher education institutions target services and programs to students at higher risk of dropping out.
About the DataThis research relies on two data sources: (1) post-secondary enrollment and graduation records from the Statewide Longitudinal Education Data System (SLEDS), which covers all for-credit public and private programs in Minnesota; merged with (2) wage record data from the Minnesota Department of Employment and Economic Development. The dataset has 450,623 enrollees from 188 post-secondary institutions in Minnesota, ages 17 to 50 at the time of enrollment who were either residents of Minnesota or had an employment record in the state after leaving college. These selection criteria mitigate the risk of treating as dropouts students who left the state and continued their education elsewhere. Graduates who earned more than one degree in the same academic year were classified according to the highest degree obtained. Students who first started college after June 2011 (in bachelor's programs) and after 2012 (in sub-baccalaureate programs) and did not finish were excluded because they may still be working toward a degree. The dataset used for the wage analysis has fewer than 450,623 records because of a few exclusions. Individuals who went to work for the federal government, owned their own small unincorporated business, or left the state do not have wage records because these workers are not covered by Minnesota's Unemployment Insurance Program. |
Official educational statistics place non-completers in the catch-all category of "some college, no degree." There are, however, considerable differences in skill level among non-completers and a wide variety of reasons for not completing. Some students might have switched programs or schools without being able to apply all their credits toward a credential or might have lost the financial aid needed to continue attending. Others might have entered postsecondary education to retrain after a job loss, then left school for work once the job market improved. And still other students might have found a job in their fields before completing and chose not to complete.
Although the specific reasons for leaving are unknown, the earnings outcomes of these students tell us a great deal about whether they benefited from longer persistence in school. To answer this critical question, we first must group students based on the quantity of postsecondary education received, using a more nuanced definition of non-completers as shown in Table 2 below:
| Table 2. Non-completer and Completer Categories | |||
|---|---|---|---|
| Highest Level of Education and Typical Credit Requirements for Each Level | Number of Students Enrolled, July 2005-June 2013 | Share | Estimated Regular Credits Taken* |
| (1) Enrolled only One Year or One Term, did not Complete (Early Dropouts) | 66,657 | 14.8% | From 0 to 20.2 |
| (2) Enrolled More Than One Year, did not Complete | 106,976 | 23.7% | Fewer than 61.6 |
| (3) Completed a Certificate from Six Months to Two Years in Length (Fewer Than 60 Credits) | 31,544 | 7.0% | 47.9 |
| (4) Completed an Associate Degree or Long-Term Certificate (60 or More Credits) | 90,146 | 20.0% | 79.9 |
| (5) Completed a Bachelor's Degree (at Least 120 Credits) | 155,300 | 34.5% | 121.3 |
| Total | 450,623 | 100% | |
|
*The data capture only fall semester credits and do not distinguish between units attempted and completed. We estimated annual credits in excess by doubling the number of fall credits. Therefore, the figures for non-completers should be interpreted as upper bound estimates rather than averages, because some non-completers might have attempted courses without completing any. Source: Statewide Longitudinal Education Data System and DEED wage record data |
|||
We find that only a minority of students (14.8 percent) interrupted their studies in the first year. The typical number of credits attempted or completed by this group is considerably lower than other groups, reflecting very little or no exposure to higher education.
Of special interest is the large group of enrollees (23.7 percent) who attended for more than one year, often accumulating enough credits to complete a certificate but failing to do so. Within this category there are several distinct sub-populations. One out of three students interrupted school for one term or more and then re-entered. While gaps in enrollment are not as detrimental as dropping out, they often involve switching school and major, which may cause difficulties transferring previous credits. Other students had to pass remedial courses before being allowed to take regular college-level credits, while still others managed to advance in their studies without interruptions or delays but did not finish. These examples show the variety of circumstances of attendance and exit, which can lead to very different earnings outcomes among non-completers.
How do non-completers fare in the labor market relative to completers? And among non-completers, do those further along in their coursework experience higher market rewards than those who leave with less education? We'll begin answering these questions by tracking the hourly wages of people who worked in Minnesota after graduation. To determine time of exit for completers we used graduation date.4 For non-completers we used the spring of the most recent academic year of enrollment, assuming that the majority left school to seek work at approximately that time.
Figure 1 plots wages for students who were between 19 and 28 at the time of exit and were still employed in Minnesota six years after graduation. The earnings trajectory of early dropouts is clearly lower than other groups, and the growth of bachelor's earnings far outpaces that of other groups.
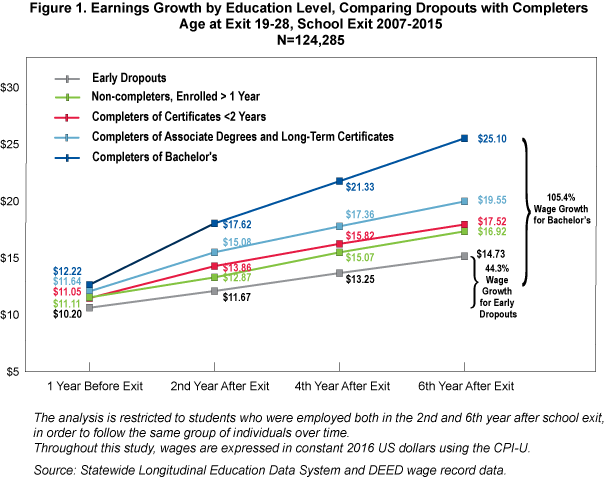
After eight years, bachelor's wages were 105.4 percent higher than they were the year before graduation – an average increase of roughly 13 percent per year – while the wages of early dropouts grew only by 44.3 percent (an increase of 5.5 percent per year).
Figure 2 displays the same information in the form of a wage premium relative to the baseline category of early dropouts.
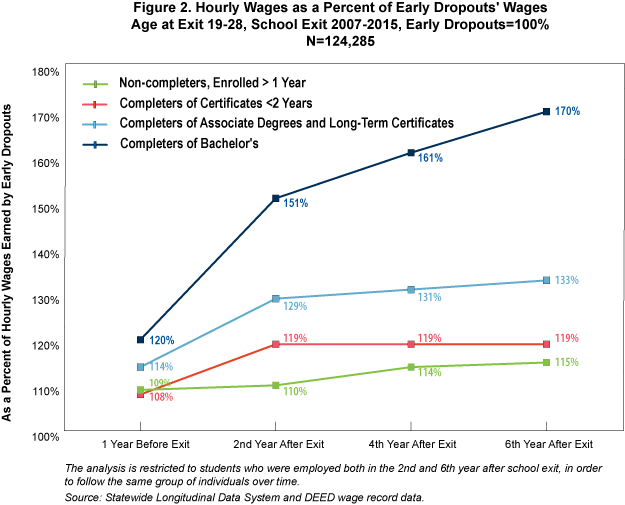
The premium for earning a four-year degree grew steadily for a few years after graduation, while the premium at lower education levels was realized in the first two years after college and then flattened. These findings suggest higher lifetime earning potential for bachelor's degree recipients. Some people entered graduate school and might be close to earning an advanced degree, which might account for some of this continued growth.
Six years after graduation, bachelor's recipients earned 70 percent more, associate degree recipients earned 33 percent more, and certificate recipients earned 19 percent more compared with early dropouts. The group of non-completers with longer enrollment, which is critical to understanding the benefits of attendance, ended up with earnings that were 15 percent higher, at the median, than early dropouts. This premium is smaller relative to all categories of completers.
Are these premiums biased upwards by compositional differences? For example, bachelor's completers are more likely to be white or Asian, and are typically older at the time of exit because of extra years spent in school. The business cycle has an effect on the wage premium, too. Students who left school during the Great Recession reaped much lower premiums than those who left after 2009. To take these factors into account we estimated the earnings differences as a function of age, gender, race, region of employment, and year of exit. Figure 3 compares the premiums before and after applying the statistical adjustments.
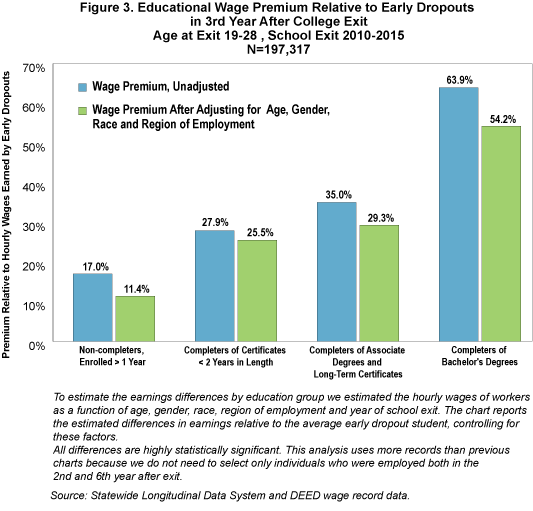
The adjustments cause a reduction in the premiums at every level, mainly because part of the earnings advantage over early dropouts is due to being older at exit and thus accumulating more work experience, rather than to college itself.
These adjustments do not change the conclusion that there are wage advantages from longer attendance. Non-completers who attended longer than a year earned 11.4 percent more than early dropouts. Meanwhile, the premium for completing is more than twice as much: 25.5 percent for certificates and 29.3 percent for associate degrees and long-term certificates. This shows that potential earnings are lost when students leave short of a credential.
Do these findings hold also for older students? People who left school after age 28 experienced lower premiums in every category except a bachelor's degree, suggesting that investments in higher education later in life are less remunerative except in the case of four-year degrees or higher credentials.
Adjusting for demographic characteristics is not enough to isolate the effects of education on wages. Other relevant factors not measured in this study include income, which affects both the quantity and quality of postsecondary education one can afford; academic achievement and quality of prior schooling, which determine college readiness; and a host of intangible characteristics such as abilities, motivation, social expectations and roles, and discrimination that shape the way students sort into schools, fields of study and eventually careers. We will limit ourselves to a discussion of the role of two factors – participation in remedial courses and choice of major – in shaping both educational and earnings outcomes.
Students are placed in remediation because they need supplementary instruction before being allowed to take college-level courses. It is a well-known risk indicator for dropping out of college, as shown in Table 1. Figure 4 delves deeper into this finding by illustrating how remediation is inversely related to educational achievement. Non-completers were much more likely to need remedial coursework (50 percent) than bachelor's completers (12 percent).
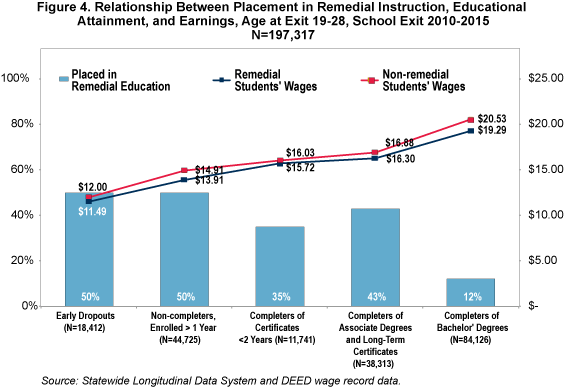
Lower-than-expected rates of remediation (35 percent) among certificate completers probably stem from the fact that short-term certificates do not require being assessed college ready. Underprepared students can obtain a vocational certificate without having to pass remedial courses, and they do better in the labor market than those with no college at all.
These results underscore how challenging it is for remedial students to access and complete a four-year degree. However, the gaps in educational attainment between less prepared and more prepared students would likely be greater without remediation. Among young remedial students, 48.3 percent graduated, and non-completers with extended stays in college earned on average 28.5 credits including remedial and regular. Without remediation they might not have completed any college-level courses.
Figure 4 also shows that the earnings of remedial students are a bit behind those of non-remedial students with comparable educational attainment. Such a straight comparison might be misleading if low-achieving students are inherently different from high-achieving students. Figure 5 offers a cleaner measure of remedial students' earning outcomes by comparing them to other remedial students who dropped out early, while also showing the corresponding wage premiums for non-remedial students.
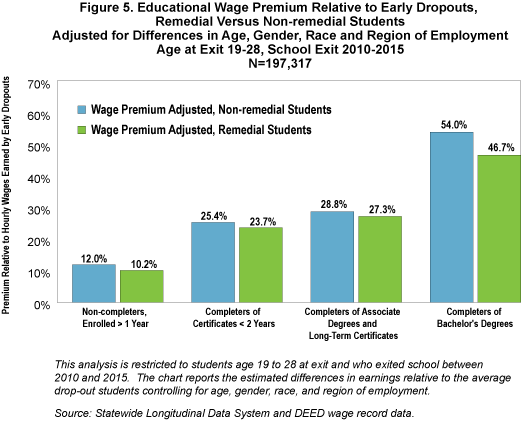
Compared with students who dropped out in the first year, remedial students earned about 46.7 percent more if they finished a bachelor's degree, 27.3 percent more if they finished an associate degree, 23.7 percent more if they finished a certificate, and 10.2 percent more if they enrolled for more than a year and did not graduate. The corresponding percentages for students who did not need remediation are 54, 28.8, 25.4 and 12 percent. These premiums are similar except at the bachelor's level where non-remedial students fared decisively better relative to dropouts (54 versus 46.7 percent). In other words, holding key demographic characteristics constant, there is still a measurable benefit from longer college persistence and completion even for underprepared students.
Remedial students are more likely to belong to a racial minority. Interestingly, when we take into account citizenship status at the time of enrollment, recent black immigrants – mainly from Somalia – have almost the same rate of remediation as blacks who were already citizens (54 percent versus 55 percent). This suggests that the need for English language instruction is not the only reason for the high concentration of black students in remedial education. Other kinds of skills gaps must be driving this result.
We also found a relationship between remediation and poverty. Looking at students who attended a Minnesota public high school, participation in remedial coursework was higher among those who attended a low-income high school (46.7 percent) and lower among individuals from wealthier high schools.5
Adjusting for key demographics and remedial status does not change the overall encouraging conclusion that there are consistent benefits from longer attendance even short of a credential. Students who don't complete, however, pay a penalty in the labor market. Smaller earnings relative to completers also mean higher risks of student loan defaults. The evidence suggests that lack of academic preparation, as well as racial and socio-economic disparities, are part of the reason some students struggle to complete. Considering that non-completers represent 38.7 percent of all enrollees, any erosion in their earnings potential represents a loss in human capital and a missed opportunity for Minnesota's economy.
One of the most important factors affecting the financial payoff from college is choice of major, both for completers and non-completers. Figure 6 compares majors that yield a large premium for completing with majors with a lower premium. In all of these fields, people who progressed further in their studies realized a wage premium compared with early dropouts, but for simplicity we are only displaying the premium for completing versus not completing.
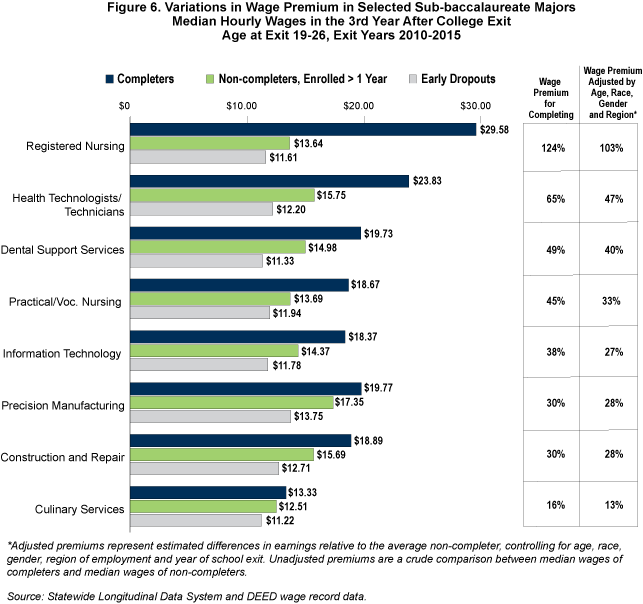
Figure 6 shows that the variation in premium for completing can sometimes be as high as the premium for earning a bachelor's degree. For example, three years after exit those who completed a registered nursing associate degree earned 124 percent more than those who enrolled in the same program but did not finish. Comparing this premium with that from programs in culinary services results in a difference of 108 percentage points, which is even more than the premium for a bachelor's degree. Adjusting for age, gender, race and region of employment does not substantially alter these dramatic differences across majors.
At the sub-baccalaureate level, premiums are higher in health care programs that prepare for an occupational license – such as registered nurses (RNs), dental assistants, physician assistants, licensed practical nurses – or for an occupational certification such as surgical technician. Being further along in coursework in RN programs does not increase earnings by much ($13.64 versus $11.61) because non-completers cannot enter these well-paying careers.
The variation in premium by major also depends on employer hiring practices. In the case of skilled trades, for example, employers tend to value work experience and on-the-job training just as much as formal credentials, so partial coursework in these fields can be valuable even without graduating. The premium for completing was 30 percent for precision manufacturing, construction, and repair. A large share of people who enrolled in these programs attended for more than one year, left without a credential, and did better than early dropouts, presumably because partial coursework equipped them with enough skills to get hired or enter an apprenticeship related to their field of study. Non-completers with more than one year of college coursework in precision manufacturing earned median hourly wages of $17.35, while those in construction and repair earned $15.69, about $3 more per hour than early dropouts. High returns for partial coursework stem from the fact that the majority of these students could break into related industries such as manufacturing, wholesale and construction, where they could leverage skills learned in school.
Programs in information technology are also fairly marketable with partial coursework because many IT job openings do not require a college degree as long as candidates can demonstrate knowledge. Thus, a modest premium for completion does not necessarily imply that the program has low market value. But low premiums combined with low wages, like in the case of culinary services, indicate low market value of the program. And partial coursework in this field offers no significant benefits compared with stopping at a high school education.
These findings also shed light on one important reason some students might voluntarily withdraw from college. The motivation to persist to graduation is weakened if students realize that formal credentials will not enhance their chances of getting a job in their career of choice. Students might intentionally drop out if they deem college coursework irrelevant and not worth the cost, or if their coursework short of a credential is relevant enough to help them access jobs related to their field of study. Since the latter phenomenon occurs more frequently in male-dominated fields such as skilled trades and IT, while the opposite is true in female-dominated fields such as health care, women overall might have more incentives to complete than men. This finding contributes to a better understanding of why women are more likely to complete a credential than men.
Wage differentials also depend on the level of difficulty of coursework and selectivity of program admission. Nursing and other health care programs require completion of 15 general education and science credits and a passing score in the Test of Essential Academic Skills.6 In contrast, open admission programs such as culinary arts do not require students to prove themselves academically able prior to enrollment. Therefore, choice of major is not merely the reflection of personal interests and aspirations but also of aptitudes and learning ability. Those who had a strong academic background before college can choose from a wider variety of subject areas and schools. In contrast, those who start with an academic or socio-economic disadvantage face restricted choices in terms of educational and career paths.
This analysis demonstrates that the college premium is higher for completers, but there are notable wage gains to be made for taking more than one year of coursework in specific academic fields. And in some majors more than in others, failing to graduate can significantly hurt earnings prospects. This finding underscores the importance of providing timely labor market information to students to help them select majors that are well-aligned with employer demand.
Thousands of students will head off to postsecondary school this year in Minnesota, but many won't make it to graduation. This study examines the labor market outcomes of all students who entered higher education in Minnesota over the last 10 years, including dropouts. The evidence shows that the risk of starting college but not making it all the way to a credential could still be worth the investment of time and tuition, but the size of the wage gain for longer college attendance varies starkly by major.
Here is a summary of findings:
These findings show that investments in higher education clearly matter. Initiatives aimed at providing career guidance to students and financial aid to help them complete a degree on time help raise the skill level of Minnesota's labor force. Policies to curb dropping out could have positive equity ripple effects by helping disadvantaged groups acquire credentials.
1Our dataset includes completion records only through June 2015.
2For-profit career schools are not as affordable as public colleges, but their unselective admissions criteria make them also appealing to certain types of students.
3Remedial courses count toward maintaining eligibility for financial aid. Remedial/developmental credits, however, will increase the length of the program when calculating the maximum time limit for a student to receive financial aid.
4Completers who subsequently re-enrolled in school to pursue a higher credential were included in the analysis. This means that associate degree completers who transferred to a four-year institution and bachelor's degree completers who re-enrolled in graduate school were included.
5Low income is defined as having 50 percent of more students eligible to receive free and reduced lunch. Remediation rates were 35 percent among students from schools with 20 to 50 percent low-income students and dropped to 29 percent for schools with less than 20 percent low-income students.
6See program admission requirements at Minnesota State.