by Dave Senf
June 2019
Note: All data except for Minnesota’s PMI have been seasonally adjusted. See the feature article in the Minnesota Employment Review, May 2010, for more information on the Minnesota Index.
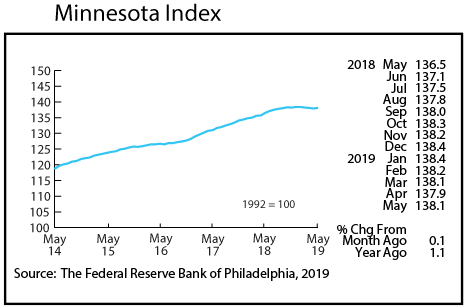
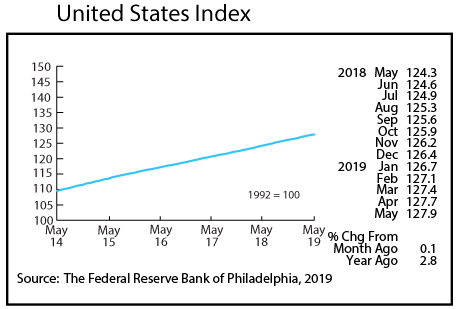
The Minnesota Index advanced for the first time this year in May, inching up 0.1 percent. May’s 138.1 reading was slightly below the peak reading of 138.4 reached in January. The small increase was caused by a jump in average weekly manufacturing hours as the state’s unemployment rate was unchanged as was wage and salary employment. The U.S. Index also increased 0.1 percent in May. Minnesota’s index growth had lagged the U.S. every month in 2019 before matching the national gain in May.
May’s readings was up 1.1 percent for Minnesota and 2.8 percent for the U.S. on an over-the-year basis. The over-the-year gap between the two indices implies that over the last 12 months the U.S. economy has expanded more than twice as fast as Minnesota’s economy. Both indices will be revised when more up-to-date employment and unemployment rate data become available. Revisions are unlikely to reverse Minnesota’s lagging economic growth relative to the U.S. pace since the middle of 2018.
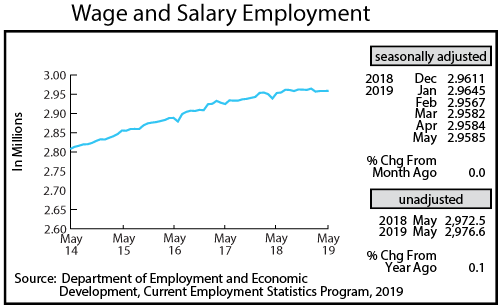
Minnesota’s adjusted Wage and Salary Employment was essentially unchanged in May with only 100 jobs added. April’s job addition was also revised down significantly from 3,600 to only 200. Minnesota’s seasonally adjusted wage and salary employment is down 2,600 through the first five months of the year. Only five other states are reporting wage and salary employment loss between December 2018 and May 2019. The other states are Iowa (3,300), Connecticut (2,800), Wisconsin (2,500), Oklahoma (2,100), and Hawaii (1,100).
Private sector payrolls were up only 400 jobs in May while public sector payrolls declined by 300 jobs. Professional and Business Services was the only supersector to add more than 1,000 jobs, but Leisure and Hospitality as well as Manufacturing each reduce their workforces by more 1,000 workers. Five supersectors boosted employment, five supersectors cut employment, and the other supersector, Mining and Logging, held employment steady. Employment was up only 0.1 percent from a year ago using unadjusted job numbers in Minnesota compared to 1.5 percent for the U.S. Minnesota job growth in the first half of 2019 is likely to be revised higher next March when the data are benchmarked, but job growth this year looks to be headed towards its slowest pace since 2010.
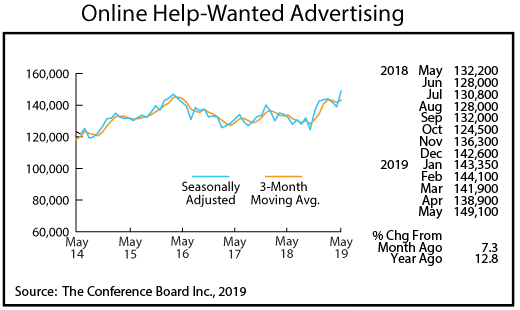
Online Help-Wanted Ads reversed direction in May and rose to a record high of 149,100. Online postings jumped 7.6 percent in Minnesota and 2.6 percent nationally. Minnesota’s share of online help-wanted ads climbed to 2.8 percent while its share of U.S. wage and salary employment remained at 2.0 percent.
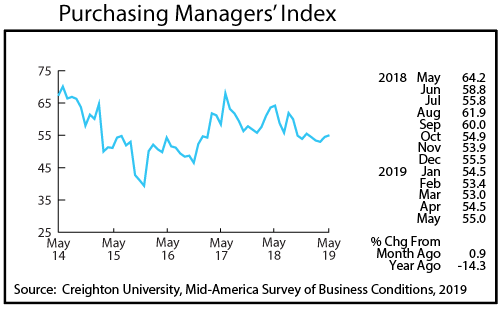
Minnesota’s Purchasing Managers’ Index (PMI) climbed moderately for the second month in a row, inching up to 55.0 in May from 54.5. Both the comparable indices, the Mid-America Business Index and the national PMI, retreated in May to 54.3 and 52.1 respectively. Minnesota’s reading has been basically flat over the last eight months, implying that manufacturing activity has been expanding in Minnesota but at a middling rate.
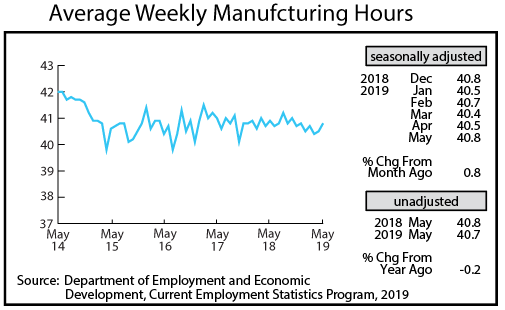
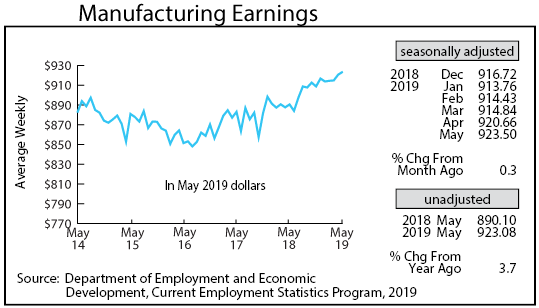
Adjusted average weekly Manufacturing Hours bounced up again in May to 40.8 hours, the longest factory workweek of the year. Factory hours had been slipping since last August, so May’s uptick is a welcome development. The longer workweek boosted average weekly Manufacturing Earnings adjusted for inflation and seasonality to $923.50 in April, setting a record high in the 49-year series for the second straight month. Real manufacturing paychecks before seasonal adjustment are running 3.2 higher over the first five months of 2019. Real factory paychecks climbed 2.4 percent in 2018.
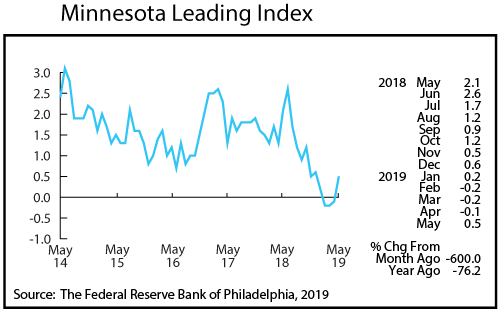
After slipping into negative territory during the previous three months, the Minnesota Leading Index climbed to 0.5 percent in May. May’s reading, while positive, is still pointing towards very slow economic growth in Minnesota over the next six months. The U.S. leading index came in at 1.3 which indicates that the national economy will be growing more than twice as fast as Minnesota’s economy over the rest of the year.
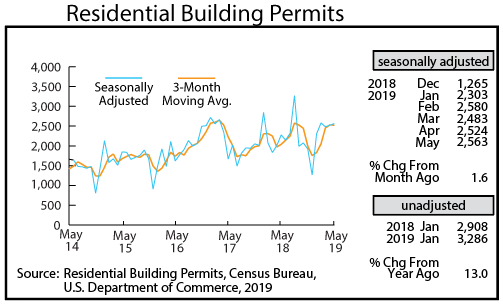
Residential Building Permits inched up in May to 2,563 which is solidly higher than the 47-year monthly average of 2,098. On an unadjusted basis home-building permits are up 16.6 percent from a year ago through the first five months and at the highest first five month total since 2006.
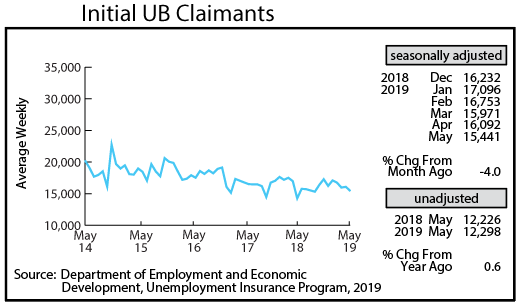
Adjusted Initial Claims for Unemployment Benefits (UB) dipped in May for the third time this year, this time to 15,441, the lowest level since last September. May’s initial claims level is the lowest recorded since 1970 when the ratio of initial claims to total wage and salary employment is used to adjust for employment growth over the years.
