by Dave Senf
March 2015
Note: All data except for Minnesota's PMI have been seasonally adjusted. See the feature article in the Minnesota Employment Review, May 2010, for more information on the Minnesota Index.
The Minnesota Index, U.S. Index, and Minnesota Leading Index are generated by the Philadelphia Federal Reserve Bank. All three indices are in the process of being reviewed and will be published in the next issue of Review.
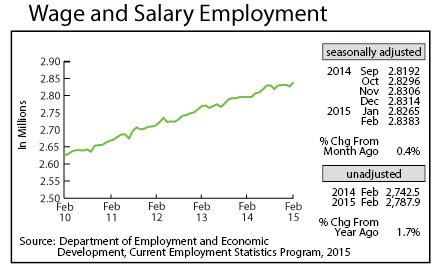
Adjusted Wage and Salary Employment recorded its largest monthly gain since April 2012 with 11,800 jobs added in February. Goods producing payrolls were up 1,000 jobs while service providing employment rose by 10,800 jobs. Strong hiring in Trade, Transportation, and Utilities and in Leisure and Hospitality drove job gains. Construction and Educational and Health Services payrolls also recorded robust growth. Minimal job loss occurred in four sectors with manufacturing cutting the most positions.
Minnesota's unadjusted over-the-year job growth jumped to 1.7 percent, the highest rate since August 2014. The state's job growth continues to lag significantly behind the national rate which was up 2.4 percent in February from a year ago. Minnesota's over-the-year job growth has lagged behind the national rate for the last seven months.
Job growth in Minnesota over the last year has been higher than nationally in only Professional and Business Services and Other Services. Manufacturing payroll expansion in Minnesota has been just a tad below national expansion, but other sectors are adding employment in Minnesota much more slowly than nationally. Minnesota job growth trails national job growth the most in the following sectors: Construction, Information, Financial Activities, and Leisure and Hospitality.
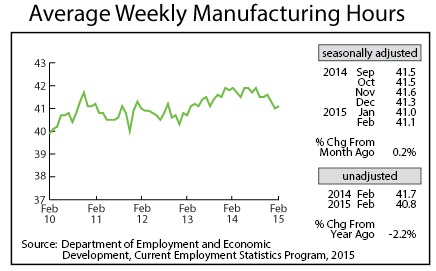
After plunging for two straight months, adjusted Manufacturing Hours ticked up in February to 41.1. The factory workweek is down significantly from a year ago which may indicate that Minnesota manufacturers have added workers to cut overtime hours, reduced hours as productivity has increased, or reduced hours in response to waning orders. There is really no way of knowing exactly why hours are down. Minnesota's annual average weekly manufacturing hours set a record in 2014 at 41.9 hours. That topped the previous 41.6 hour record recorded in 1994. The lowest annual factory workweek was in 2009 at 39.0 hours.
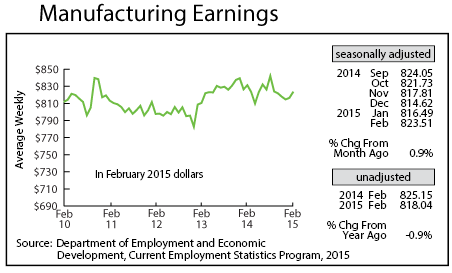
February's Manufacturing Earnings climbed for the second month in a row to a five-month high of $823.51. Factory paychecks, however, are still below a year ago after adjusting for inflation.
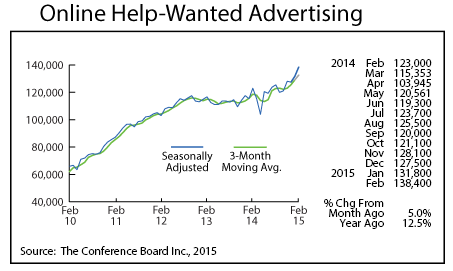
Minnesota's adjusted online Help-Wanted Ads continued to rise, increasing for the fourth time in the last five months in February. February's 138,400 ad level was up 5.0 percent from last month, topping the 3.5 percent national increase. Minnesota's ad level is 12.5 percent higher than a year ago which also tops the national 9.9 percent over-the-year gain.
Minnesota's share of national help-wanted online advertising remains solid at 2.5 percent compared to the state's 2.0 percent of employment. One possible explanation for why Minnesota's job growth has lagged the U.S. rate despite stronger online job advertising is that Minnesota employers may post a higher percent of job openings online than in other parts of the country.
Another possible explanation for Minnesota's slower job growth is that Minnesota employers are having a harder time finding workers because of the state's lower unemployment rate. The ratio of unemployed per job vacancy fell to 1.1 in the recently released fourth quarter 2014 Minnesota Vacancy Job Survey results. That is the second lowest on record, slightly higher than the 0.9 ratio experienced in the second quarter 2001. Employers had a much easier time finding workers during the fourth quarter of 2009 when the unemployed to job vacancy ratio skyrocketed to 8.2.
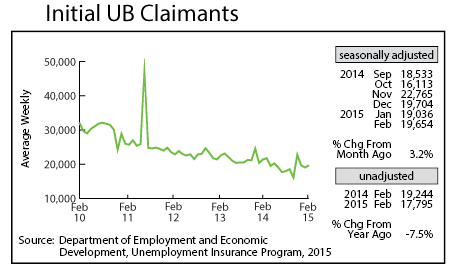
Adjusted Initial Claims for Unemployment Benefits (UB) inched up to 19,654 in February but continued to remain comfortably low by historical standards indicating that Minnesota's job growth will remain positive.