by Mark Schultz
February 2020
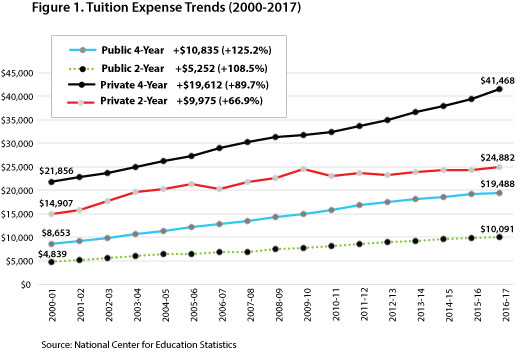
College can be an expensive choice, whether you choose to go to a public two-year institution or a private four-year university, and annual tuition in the United States has seen a fairly large increase over the years. One article posted on Yahoo! Finance states that the average cost of college is 31 times higher than it was in 1969.1 In more recent years college tuition in the United States has seen massive gain. As shown in Figure 1, data from the National Center for Education Statistics show that since 2000, and depending on institution type (public vs. private/2-year vs. 4-year), tuition has risen anywhere from 66.9 percent for private two-year colleges to 125.2 percent for public four-year colleges.

While it is not always the case, many times the furthering of educational attainment beyond high school results in higher wages. This can also, however, increase the amount of student loan debt as many higher paying occupations require more years of education, e.g., architects, computer systems analysts, lawyers, and doctors. According to 2018 annual report of the Institute for College and Access and Success, Minnesota ranks among the highest states in average student loan debt for the class of 2017, resting at $31,3642. Furthermore, according to a recent article in Forbes Magazine, the price tag on a college education has increased almost eight times faster than wages have increased3.
Thus for many individuals choice of a career path may be influenced by subsequent earning potential as students find themselves looking at occupations that pay more to help offset the amount of college debt they accrue. Southeast Minnesota is ripe with employment opportunities for jobs that require various levels of post-secondary education and are also characterized by high wages.
According to DEED’s Occupations in Demand data, there are several occupations at all levels of post-secondary education that are both in demand and pay well. Higher post-secondary education, however, doesn’t always equate to higher wages in the Southeast region. For example, radiation therapists with an Associate’s Degree earn a median annual wage of $81,015, which is higher than the median annual wage for elementary school teachers with a Bachelor’s Degree and mental health and substance abuse counselors with a Master’s Degree (see Table 1).
| Post-Secondary Non-Degree Award | Associate's Degree | Bachelor's Degree | Masters or Doctoral Degree |
|---|---|---|---|
| Nursing Assistants ($33,876) | Registered Nurse ($74,920) | Elementary School Teachers ($54,586) | Nurse Practitioners ($122,072) |
| Machinists ($45,646) | Surgical Technologist ($59,000) | Secondary School Teachers ($62,197) | Clinical, Counseling, and School Psychologists ($81,446) |
| Licensed Practical Nurses ($47,339) | Radiologic Technologist ($73,642) | Systems Software Developers ($95,225) | Physical Therapists ($86,684) |
| EMTs and Paramedics ($38,092) | Police and Sheriff Patrol Officers ($62,819) | Industrial Engineers ($80,829) | Nurse Anesthetists ($199,092) |
| Industrial Machinery Mechanics ($51,462) | Respiratory Therapists ($68,716) | Middle School Teachers ($56,991) | Child, Family and School Social Workers ($61,811) |
| Hairdressers, Hairstylists and Cosmetologists ($25,344) | Cardiovascular Technologists and Technicians ($63,841) | Applications Software Developers ($92,109) | Physician Assistants ($119,114) |
| Auto Service Techs and Mechanics ($39,411) | Industrial Engineering Technicians ($44,015) | Computer and Information Systems Managers ($110,267) | Pediatricians ($207,182) |
| Medical Records and Health Info. Technicians ($46,346) | Radiation Therapists ($81,015) | Accountants and Auditors ($61,932) | Family and General Practitioners ($190,853) |
| HVAC Mechanics and Installers ($49,614) | Dental Hygienists ($71,650) | Human Resource Specialists ($56,162) | Mental Health and Substance Abuse Social Workers ($45,292) |
| Tool and Die Makers ($54,037) | Paralegals and Legal Assistants ($51,466) | Computer Systems Analysts ($80,701) | Healthcare Social Workers ($53,971) |
| Source: DEED Occupations in Demand | |||
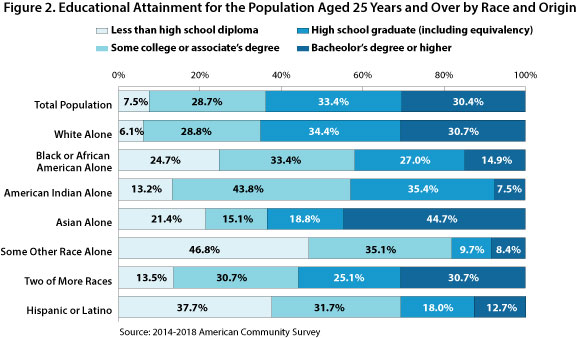
In the Southeast region disparities exist in educational attainment by race. As shown in Figure 2, multiple racial or ethnic groups have a higher percentage of individuals with a high school diploma or less. For example, among the American Indian population, over half (57 percent) have only a high school diploma or less, while the Black or African American population saw 58.1 percent with only a high school diploma or less. Additionally, almost 70 percent (69.4) of those identifying as Hispanic or Latino and over three-quarters (81.9 percent) of those of Some Other Race have this level of education.

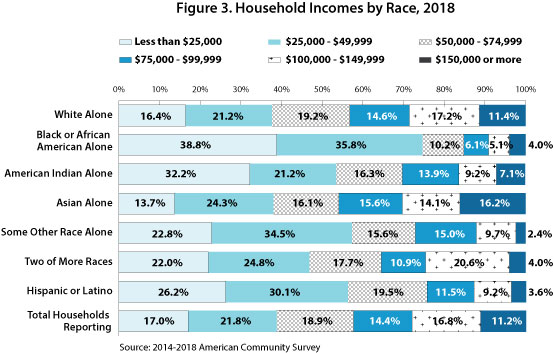
Arguably there is a correlation between disparities in educational attainment and household incomes by race. An astounding 74.6 percent of Black or African American households have incomes of less than $50,000 as do 53.4 percent of American Indian households. In addition, among Hispanic or Latino households, 56.3 percent earn less than $50,000 while households of Some Other Race saw 57.3 percent having low incomes.

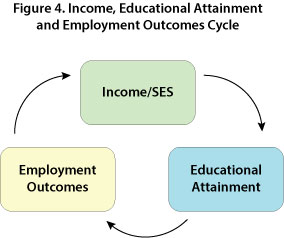
Research conducted by the American Psychological Association shows a link between low socioeconomic status (of which income is a part) and lower educational attainment4. More specifically, according to one article "Children from low-SES [socioeconomic status] families enter high school with average literacy skills five years behind those of high-income students" (Reardon, Valentino, Kalagrides, Shores, and Greenburg)5. Additionally, according to the National Center of Education Statistics, among young people (ages 16 to 24), those from low-income families saw a higher high school dropout rate than those in high-income families6. It appears, though, that the relationship between low educational attainment and low household incomes could be a reciprocal one as those from lower SES families may have limited educational opportunities which subsequently turns into fewer opportunities for high-paying jobs. The cycle keeps on rolling in this fashion.
Research also shows that social class, which is highly influenced by income, can be a key player in "career aspirations, trajectory, and achievement."4 For example, Diemer and Blustein's (2007) research shows that "racial, ethnic, and socioeconomic barriers generally hinder individuals' vocational development"7. These limited career aspirations could lead to limited employment opportunities, especially among high-paying jobs that require education beyond high school.
As a result of the racial disparities in income, which could be correlated with education attainment and career opportunities/choices, the Southeast region is also seeing racial/ethnic discrepancies in poverty rates. The same groups discussed in the above narrative - Black or African American, American Indian, Hispanic and Latino, and those of Some Other Race - also see higher percentages below the poverty level. The highest percentage were seen among Black or African Americans, which group saw 41.8 percent below the poverty level, followed by 32.9 percent of American Indians. Both Some Other Race and Hispanic or Latino saw about 23 percent each below the poverty level (see Table 2).
| Race/Ethnicity | Total Population | Income Below the Poverty Level | Poverty Rate (% below poverty level) | Income At or Above the Poverty Level | Minnesota Poverty Rate |
|---|---|---|---|---|---|
| White Alone | 438,608 | 37,320 | 8.5% | 401,288 | 7.9% |
| Black or African American Alone | 15,763 | 6,592 | 41.8% | 9,171 | 31.9% |
| American Indian Alone | 1,496 | 492 | 32.9% | 1,004 | 31.5% |
| Asian Alone | 14,118 | 1,546 | 11.0% | 12,572 | 15.4% |
| Some Other Race Alone | 7,178 | 1,697 | 23.6% | 5,481 | 23.4% |
| Two or More Races | 9,056 | 1,654 | 18.3% | 7,402 | 18.3% |
| Hispanic or Latino | 26,705 | 5,966 | 22.3% | 20,739 | 20.9% |
| Total Population | 486,219 | 49,301 | 10.1% | 436,918 | 10.5% |
| Source: 2014-2018 American Community Survey, 5-Year Estimates | |||||
As a result of these discrepancies, many residents of Southeast Minnesota may find themselves in an unfortunate cycle. Students' income/socioeconomic status could hinder their ability/aspirations to obtain post-secondary education, which in turn could lead to employment in lower-paying jobs, which loops back to lower earnings and socioeconomic status.

1DePietro, Andrew. (April 9, 2019). Average cost of College Has Jumped an Incredible 3,009% in 50 Years.
2The Institute for College Access and Success. (2018). Student Debt and the Class of 2017.
3Maldonado, Camilo. (July 24, 2018). Price of College Increasing Almost 8 Times Faster Than Wages.
4American Psychological Association. Education and Socioeconomic Status.
5Reardon, S.F., Valentino, R.A., Kalogrides, D., Shores, K.A., and Greenberg, E.H. (2013). Patterns and Trends in Racial Academic Achievement Gaps Among States, 1999-2011.
6National Center for Education Statistics. (2008). Percentage of high school dropouts among persons 16 through 24 years old (status dropout rate), by income level, and percentage distribution of status dropouts, by labor force status and educational attainment: 1970 through 2007.
7Diemer, M. A., & Blustein, D. L. (2007). Vocational hope and vocational identity; Urban adolescents' career development. Journal of Career Assessment, 15, 98-118.