by Dave Senf
February 2019
Note: All data except for Minnesota’s PMI have been seasonally adjusted. See the feature article in the Minnesota Employment Review, May 2010, for more information on the Minnesota Index.
The Minnesota Index, U.S. Index, and Minnesota Leading Index are generated by the Philadelphia Federal Reserve Bank. At the beginning of each year the indices are delayed by two months as revised component numbers are used to recalibrate the indices. Updated coincident indices are scheduled for release on April 1 while leading indices will be released April 4.
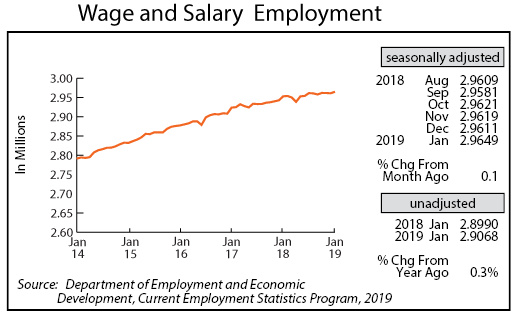
After two months of small decreases, Minnesota’s adjusted Wage and Salary Employment rose in January by 3,800 jobs. Revised employment numbers show that average monthly seasonally adjusted employment growth was just 1,525 in 2018, so job growth got off to a good start in January. The state added 11,500 jobs during the first half of 2018 and 6,800 during the second half, adding up to 18,300 new jobs between December 2017 and 2018. Over-the-year job growth, using seasonally adjusted numbers, was estimated at 32,200 between December 2017 and December 2018 before being revised down to 18,300 during the annual benchmarking of employment data.
All of January’s job growth was on the service-providing side as goods-producing jobs were reduced by 400 positions. Payroll numbers increased the most in Leisure and Hospitality, Trade, Transportation, and Utilities, and Financial Activities. Payrolls were trimmed the most in Education and Health.
Minnesota’s unadjusted over-the-year job growth held steady at 0.3 percent in January. The annual average job growth rate was revised down from 1.2 to 0.7 percent for 2018, the lowest annual rate since 2010. The 0.7 percent annual average increase translates into 22,000 jobs on an annual average basis in 2018 compared to 38,500 in 2017 when job growth was 1.3 percent. Annual average job growth nationally in 2018 was 1.6 percent, matching the 2017 rate.
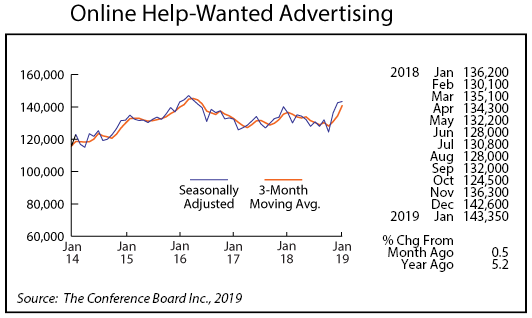
Online Help-Wanted Ads climbed to 143,350 in January which is the fourth highest level over the 14 years of online job posting data. Minnesota’s job posting was up 0.5 percent compared to 1.5 percent nationwide. Minnesota’s share of online help-wanted remained at 2.7 percent.
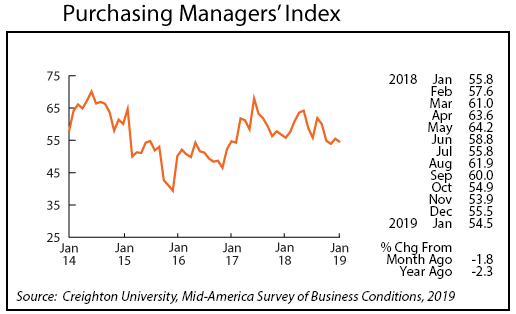
Minnesota’s Purchasing Managers’ Index (PMI) reversed direction in January, slipping to 54.5 from 55.5. The two other comparable indices both increased in January with the Mid-America Business Index advancing to 56.0 and the national PMI climbing to 56.5. Minnesota is one of nine states covered in the Mid-America Index.
Minnesota’s index peaked in the middle of 2018 and has been trending downwards over the last six months. The downward drift suggests that Minnesota’s economy will continue to expand over the first half of 2019, but the pace will be slower than in 2018.
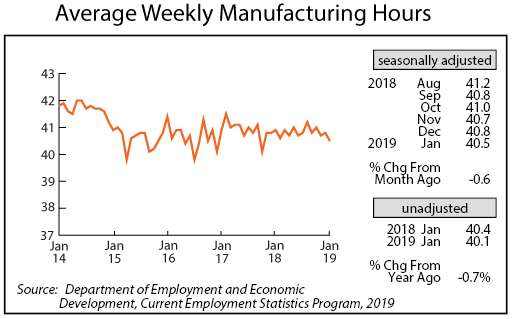
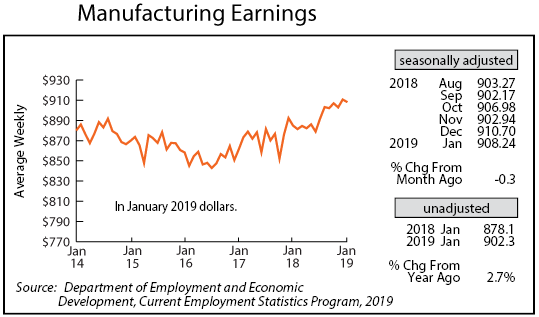
Adjusted average weekly Manufacturing Hours dropped to 40.5 hours in December, its lowest level since October 2017. The annual average factory workweek for 2018 was 40.8 hours in 2018, just slightly down from 40.9 in 2017. The 40.8 average factory workweek in 2018 was higher than the 49-year average of 40.5 hours. Average weekly Manufacturing Earnings, adjusted for inflation and seasonality, slipped slightly in January to $908.24. That was up 2.6 percent in real terms from last January.
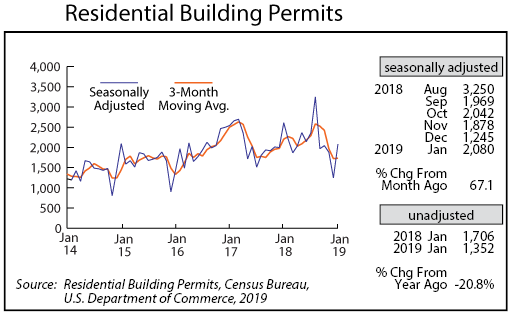
The adjusted Residential Building Permits level rebounded from the second-lowest monthly level over the last five years in December to 2,080 in January. Home-building permits have averaged roughly 2,100 over the last 39 years, so January’s level was right around average.
The 26,318 permit total issued in 2018 was 8.7 percent higher than the 2017 permits. Home-building permits bottomed out in 2011 when only 8,309 permits were issued. A record 40,659 home-building permits were issued in 2004 at the peak of the housing boom. Minnesota’s home-building permits were 2.0 percent of total U.S. home-building permits in 2018 which is slightly higher than Minnesota’s 1.7 percent share of U.S. population.
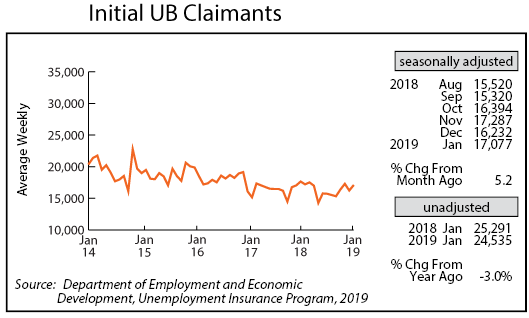
Adjusted Initial Claims for Unemployment Benefits (UB) increased to 17,077 in January, continuing a slight upward trend over the last few months. Initial claims, which is a proxy for the layoff rate, remains low by historical standards despite the recent upward drift.