by Alessia Leibert
March 2024
A college education is one of the biggest investments most people ever make. Prospective college students wrestle with questions like: Which schools have the most appealing programs? Will I be able to find a job after college that allows me to pay back my student loans and support myself and my family? What types of businesses employed students with the training credential I am most interested in?
The Graduate Employment Outcomes (GEO) tool has just been updated with outcomes for students who graduated in 2020-21. The tool, launched 10 years ago, was one of the first of its kind in the nation. A unique advantage of the tool is its ability to disaggregate program outcomes by 252 majors, four award levels and 98 postsecondary schools, both public and private, throughout Minnesota.
The tool displays the following key program outcome measures:
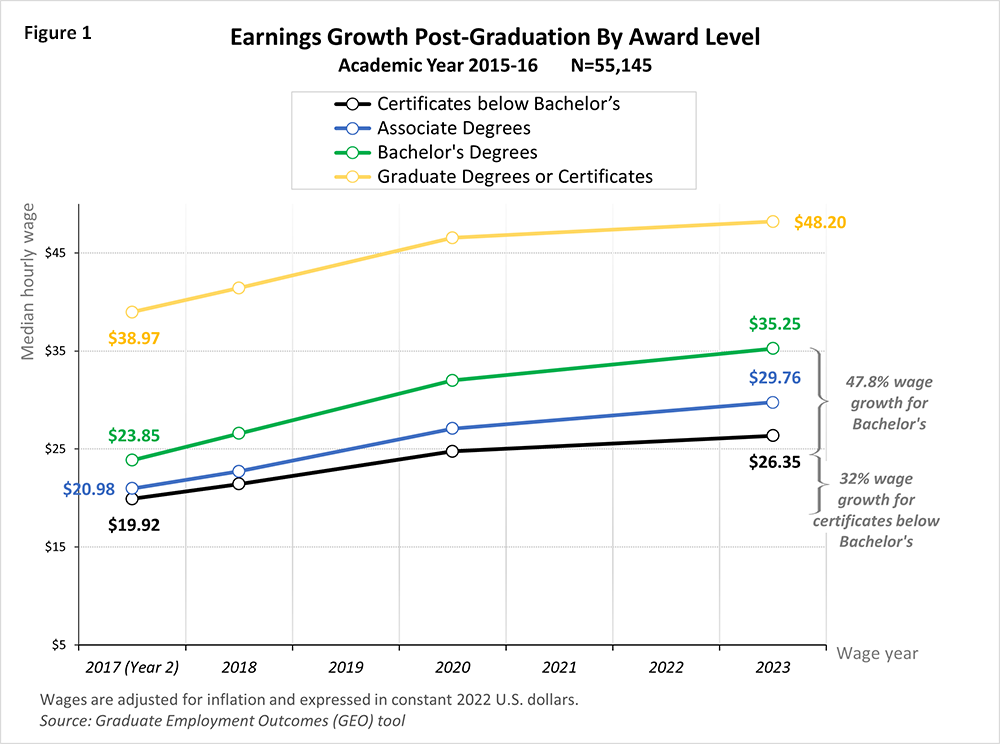
The first tab of the tool shows how fast wages grew between two and eight years from credential completion. Figure 1 plots these figures by award level, showing that additional education leads to higher future wages, when viewed in the aggregate. Students who completed certificate programs requiring two years or less of study (black line) had the lowest starting median hourly wage at $19.92 and modest wage growth (32%). Students earning graduate degrees had the highest starting median wage at $38.97 but the slowest wage growth, because they generally enter these programs at an older age when they already have experience in their career. Bachelor's degree completers (green line) saw the fastest wage growth, 47.8% in seven years.

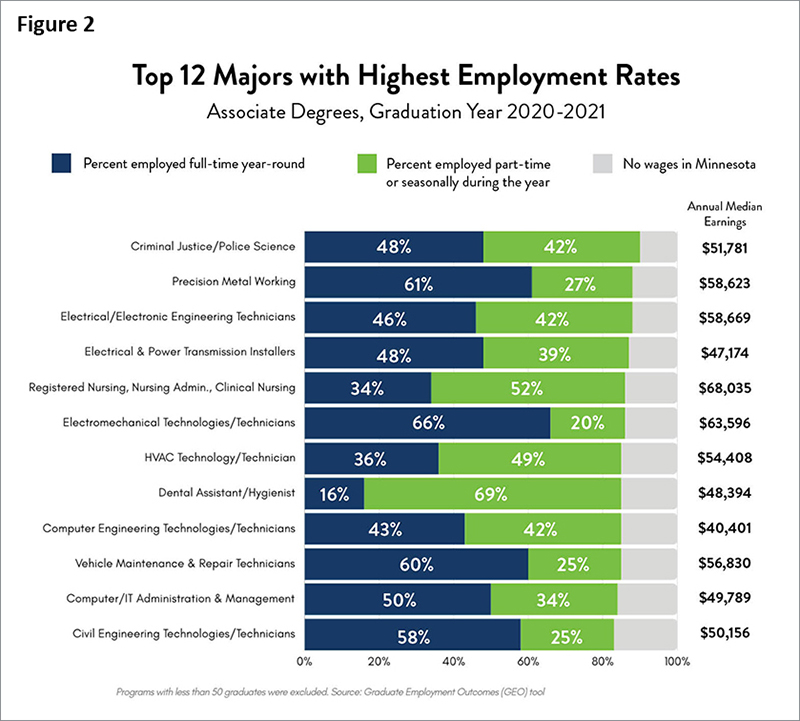
A unique benefit of the tool is its ability to disaggregate program outcomes by 252 individual majors1. Comparisons by major and education level help sort out educational opportunities. Some of the most often overlooked opportunities are those below a bachelor's degree. The tool allows users to select all associate degrees statewide and then rank majors by "Percent graduates employed in Minnesota during the second year after graduation"2. The results are displayed in Figure 2, limited to the top 12 programs with more than 50 graduates3.

Associate degrees are more attainable than a bachelor's degree for the average person in the workforce. Since high employability of graduates means successful alignment with demand, we know that the programs shown in Figure 2 are effectively meeting the needs of Minnesota employers. However, not all programs with high employability are equally successful at helping students get fulltime jobs or secure a family-sustaining wage. The blue bars show a wide variation among programs in the percentage of fulltime versus part-time employment, ranging from the longest blue bars in Electromechanical Technologies (66% graduates with fulltime jobs) to the lowest in Dental Assistant/Hygienist programs (only 16% with fulltime jobs).
This suggests that graduates from the Electromechanical Technologies program achieved job stability and access to healthcare benefits faster than graduates from other programs in this list. Annual median earnings were also high, at $63,596. This information can be helpful to students to weigh the pros and cons of different programs.
The tool also displays, through interactive graphs, the industries and regions of the state where graduates found work.
Even though we have no information on the types of occupations graduates were employed in, the tool offers a detailed breakdown of industries of employment, giving an idea of the types of firms that are more likely to employ individuals with credentials in each area. This information can be very useful for someone who might wonder if certain degrees or majors improve the chances of finding a job in the industries of choice.
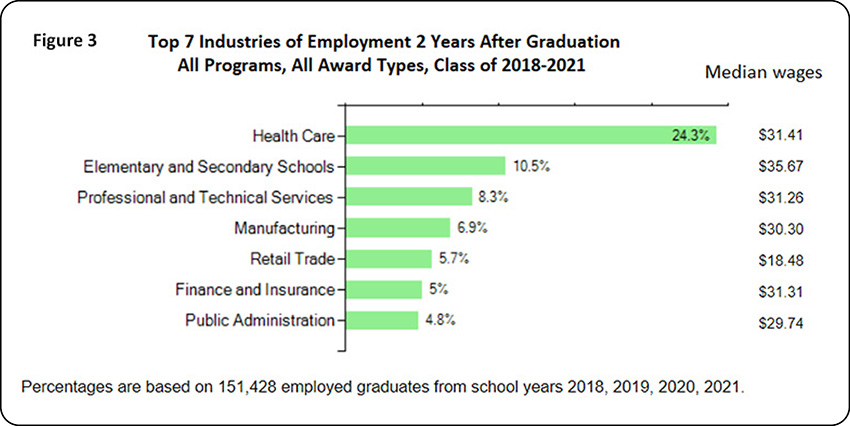
Figure 3 shows that, overall, the Health Care sector absorbed 24.3% of all graduates in school years 2018-2021, followed by Elementary & Secondary Schools at 10.5%. These two sectors are the largest in the state in terms of employment. For additional data on industries of employment see the College Major to Industry of Employment tool and companion article.

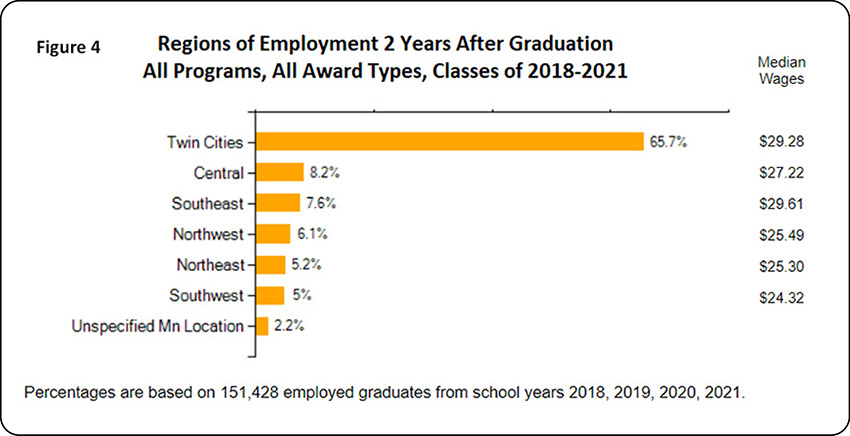
In terms of regions of employment, the overwhelming majority of recent graduates, 65.7%, found work in the Twin Cities Metro, where wages were higher than other regions except Southeast (see Figure 4).

The industry and geography information presented in Figures 3 and 4 is accessible through the GEO tool by each individual program, award type, and postsecondary institution in Minnesota.
In a time of rising tuition costs, prospective students need access to high-quality information to make smart choices about their future. The data presented in this tool are also the foundation for evaluating the effectiveness of public investments to build a competitive workforce and for identifying emerging areas of educational opportunities that might have been overlooked in the past. This can help students find a successful path from high school to college and into the workforce.
1Majors are defined as instructional programs at the 4-digit level, as classified by the U.S. Department of Education Classification of Instructional Programs (CIP). The tool includes only those programs reported to the Minnesota Department of Higher Education which have at least 10 graduates.
2To navigate to this result in the GEO tool, select "Associate degree" in the Award Type filter and "All programs at Most Detailed Level, subtotal" in the Instructional Program filter. Then click on the "Employment Status" tab and rank-order the list by the "Percentage Graduates With reported Wages in MN" field.
3This cutoff was applied to avoid displaying results for smaller populations, which tend to be more volatile from year to year.