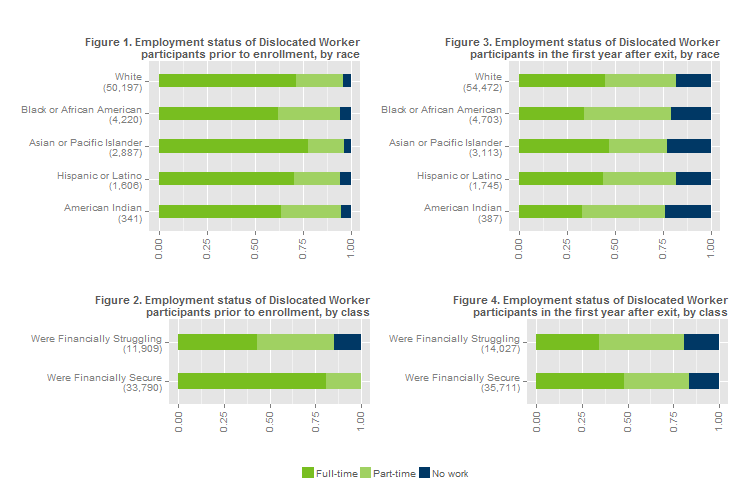
Figures 1 through 4 show the full-time and part-time employment status before and after participation in Dislocated Worker. See more about the data sources used in this report in Appendix C. Read our definitions of race, class, and employment in Appendix D.

Generally speaking, prior employment is a condition of enrollment in the Dislocated Worker program, which explains why nearly every participant is working prior to participation in the program. The exceptions to this are long-term unemployed individuals and individuals laid off from employment in other states (employment not covered by Minnesota's Wage Detail).
However, we do see disparities in full-time employment. Fewer than half of participants who were financially struggling prior to participation worked full time, compared with over 80% of those who were financially secure (Figure 1). Of course, according to our definition of class, everyone who was financially secure had at least a part-time job. Full-time employment rates range from a high of 78% among Asian or Pacific Islander participants to 62% among Black or African American participants (Figure 2).
It is important to note that we do not know whether these part-time workers actually wanted full-time work. Among other things, part-time work may have allowed for family care or school attendance.
Across all race and class groups, employment levels in the year after program participation are lower than those in the year prior to program participation. Again, the share with no work is roughly similar across race and class groups—the employment disparity appears when looking at full-time employment. Among those who were financially struggling prior to program participation, only about one third found full-time employment after program participation—compared to nearly half among those who were financially secure (Figure 4). American Indian participants have a full-time employment rate of about one third, compared to nearly half of Asian or Pacific Islander participants (Figure 3).