by Cameron Macht
August 2013
Management, Scientific, and Technical Consulting Services is one of the fastest growing and highest paying industry sectors in Minnesota. However, like the work these consultants perform, much of this growth happened behind the scenes.
Consultants provide their clients with valuable technical expertise, skills, or services that they don't have in-house or can't handle themselves. As regulations and markets have become increasingly complex, more organizations have turned to consultants to help them succeed. They contract out essential business functions including marketing, human resources, information systems, supply chain management, and strategic planning among many other areas.
Because anyone with expertise in a specific area can become a consultant, opportunities for small businesses to join the industry and make some money abound. In fact, almost 85 percent of consulting firms in Minnesota had fewer than five employees, while less than 2 percent of consulting firms had more than 50 employees.
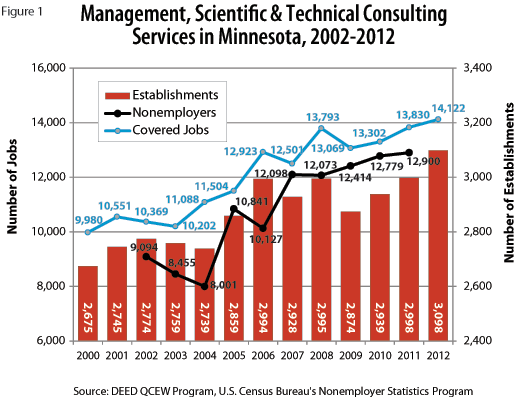
After expanding almost 40 percent over the last decade, there are now nearly 3,100 Management, Scientific, and Technical Consulting Services employer establishments in Minnesota, providing just over 14,100 jobs. In addition, there were another 12,900 self-employed consultants. Combined, there are about 27,000 people working in the consulting sector in Minnesota (Figure 1).

Since they rely on business from other industries for their business, consulting services are also negatively impacted by recessions. Following the recession in 2001, many consulting gigs dried up, especially for self-employed consultants. However, as the economy began growing in the middle part of the decade, consultants began hiring again and hundreds of brand new nonemployer establishments popped up. Interestingly, the increases in self-employment seemed to coincide with declines in covered employment, while drops or slowdowns for nonemployers matched up with hiring bursts at employer establishments.
Since the recession at the end of 2007, the Management, Scientific, and Technical Consulting Services sector has gained 170 net new business establishments, more than 1,600 net new jobs, and more than 800 nonemployer establishments. These consultants and contract workers have capitalized on outsourcing trends, filling a vital lack for businesses that need to get up to speed quickly.
As noted above, the Management, Scientific and Technical Consulting Services sector has 3,098 business establishments providing 14,122 covered jobs, according to data from DEED's Quarterly Census of Employment and Wages (QCEW) program. Industry payrolls surged past $1.2 billion in 2012, with average annual wages closing in on $90,000 (Table 1).
| Minnesota Industry Employment Statistics, 2012 | |||||
|---|---|---|---|---|---|
| NAICS Industry Title | NAICS Code | Number of Establishments | Number of Covered Jobs | Total Industry Payroll, 2012 | Average Annual Wages |
| Total, All Industries | 0 | 168,334 | 2,644,895 | $130,505,921,144 | $49,348 |
| Management, Scientific, and Technical Consulting Services | 5416 | 3,098 | 14,122 | $1,224,889,307 | $86,632 |
| Management Consulting Services | 54161 | 2,251 | 10,916 | $996,641,129 | $91,260 |
| Admin. Mgmt. and General Mgmt. Consulting | 541611 | 998 | 4,242 | $404,801,438 | $95,420 |
| Human Resources and Exec. Search Consulting | 541612 | 205 | 1,114 | $100,308,185 | $90,116 |
| Marketing Consulting Services | 541613 | 479 | 2,522 | $198,788,154 | $78,728 |
| Process, Distribution, and Logistics Consulting | 541614 | 179 | 1,537 | $162,259,117 | $105,664 |
| Other Management Consulting Services | 541618 | 391 | 1,500 | $130,484,235 | $86,996 |
| Environmental Consulting Services | 54162 | 141 | 947 | $64,645,857 | $68,172 |
| Other Scientific and Technical Consulting Services | 54169 | 706 | 2,259 | $163,602,321 | $72,332 |
| Source: DEED (QCEW) | |||||
The largest and most identifiable sector is Management Consulting Services, with nearly 11,000 jobs at 2,251 establishments. The largest subsector within that is Administrative Management and General Management Consulting Services, which had just under 1,000 establishments and 4,250 jobs in 2012. Consultants in this specialty provide high-value services including financial planning and budgeting, equity and asset management, records management, strategic and organizational planning, site selection, new business startup, and business process improvement, leading to average annual wages over $95,000.
The next largest subsector is Marketing Consulting Services, which includes providing advice and assistance to businesses on marketing planning and strategy, new product development, sales forecasting, licensing and franchise planning, and other marketing issues. Minnesota has just under 500 firms in this category with just over 2,500 jobs.
There are 179 consulting firms providing 1,537 jobs in Process, Distribution, and Logistics Consulting Services, offering technical expertise in areas such as manufacturing operations and productivity improvement, quality assurance and quality control, production planning and control, inventory management and distribution networks, and transportation, warehousing, and materials management and handling. The average annual wage of $105,664 made this the highest paying subsector in the state.
Though technically a catch-all category, the Other Management Consulting Services subsector concentrated primarily on the telecommunications and utilities industries. There were 391 firms and 1,500 jobs in Minnesota in 2012 with average annual wages of $86,996.
Finally, the Human Resources and Executive Search Consulting Services subsector provided 1,114 jobs at 205 firms. This well-known specialty includes compensation and benefits planning, labor relations consulting, assessment and organizational development services, and 'head-hunting' services.
Bolstered by the strength of Minnesota's farm economy, the state's second largest consulting sector is Other Scientific and Technical Consulting Services, which includes agricultural, biological, and chemical consulting services, as well as energy, safety, and security consulting services. This sector more than doubled over the last decade - growing like a weed from 1,043 jobs in 2002 to 2,259 jobs in 2012, a 117 percent increase.
The smallest sector is Environmental Consulting Services, which helps businesses identify, measure, and evaluate environmental conditions - specifically regarding pollutants, toxic substances, and hazardous materials - and then helps recommend and implement solutions.
To meet their clients' needs, these consulting services typically employ a small but multi-disciplined staff of analysts, managers, specialists, scientists, engineers, and other technicians with expertise in a broad range of domains. For example, human resources consultants might rely on management analysts, accountants, or training specialists while environmental consultants might have air and water quality specialists or experts in environmental law on staff.
Not surprisingly, most of these jobs require specific education or training plus relevant work experience. Because of higher educational attainment, employees in Management, Scientific, and Technical Consulting Services are also higher wage earners, with median wages ranging from about $15 an hour for office clerks to $45 an hour for software developers (Table 2).
| Top 25 Occupations in Management, Scientific and Technical Consulting Services Sector, 2013 | ||||||||
|---|---|---|---|---|---|---|---|---|
| Occupational Title | Percent of Industry Workers | Median Hourly Wage | Estimated Employment 2010 | Projected Employment 2020 | Percent Change 2010-2020 | Numeric Change 2010-2020 | 2010-2020 Replacement Openings | 2010-2020 Total Openings |
| Total, All Occupations | 100.0% | $17.95 | 2,830,000 | 3,198,000 | 13.0% | 368,000 | 663,320 | 1,041,750 |
| Management Analysts | 14.4% | $37.42 | 12,127 | 14,181 | 16.9% | 2,054 | 1,980 | 4,030 |
| Office Clerks, General | 4.2% | $14.31 | 62,156 | 70,718 | 13.8% | 8,562 | 11,000 | 19,560 |
| Business Operations Specialists, All Other | 4.0% | $28.47 | 44,157 | 48,715 | 10.3% | 4,558 | 8,470 | 13,030 |
| General and Operations Managers | 3.7% | $42.16 | 30,604 | 31,524 | 3.0% | 920 | 5,690 | 6,610 |
| Customer Service Representatives | 3.4% | $16.82 | 40,659 | 45,416 | 11.7% | 4,757 | 11,550 | 16,310 |
| Market Research Analysts | 3.0% | $30.62 | 8,045 | 10,679 | 32.7% | 2,634 | 2,140 | 4,770 |
| Executive Secretaries and Exec. Admin. Assistants | 2.9% | $22.09 | 27,092 | 29,645 | 9.4% | 2,553 | 3,630 | 6,180 |
| Secretaries and Administrative Assistants | 2.8% | $17.96 | 13,307 | 13,761 | 3.4% | 454 | 1,780 | 2,230 |
| Accountants and Auditors | 2.5% | $29.01 | 23,994 | 27,056 | 12.8% | 3,062 | 5,150 | 8,210 |
| Sales Representatives, Services | 2.3% | $25.22 | 12,576 | 14,594 | 16.0% | 2,018 | 3,690 | 5,710 |
| Bookkeeping, Accounting, and Auditing Clerks | 2.1% | $17.52 | 35,809 | 39,616 | 10.6% | 3,807 | 3,940 | 7,750 |
| Computer Systems Analysts | 1.8% | $37.42 | 12,819 | 14,733 | 14.9% | 1,914 | 2,400 | 4,310 |
| Environmental Scientists and Specialists | 1.7% | $29.29 | 1,541 | 1,714 | 11.2% | 173 | 460 | 630 |
| Human Resources and Training Specialists | 1.6% | $25.10 | 9,126 | 10,814 | 18.5% | 1,688 | 1,540 | 3,230 |
| Software Developers, Systems Software | 1.5% | $45.56 | 7,688 | 8,911 | 15.9% | 1,223 | 800 | 2,020 |
| First-Line Supervisors of Office and Admin. Support Workers | 1.5% | $23.83 | 24,243 | 26,766 | 10.4% | 2,523 | 6,480 | 9,000 |
| Software Developers, Applications | 1.4% | $43.91 | 14,722 | 17,192 | 16.8% | 2,470 | 1,530 | 4,000 |
| Financial Analysts | 1.0% | $34.13 | 5,230 | 6,030 | 15.3% | 800 | 1,110 | 1,910 |
| Network and Computer Systems Administrators | 1.0% | $34.54 | 9,559 | 11,334 | 18.6% | 1,775 | 1,620 | 3,400 |
| Computer Support Specialists | 1.0% | $23.11 | 11,591 | 12,732 | 9.8% | 1,141 | 3,040 | 4,180 |
| Info. Security Analysts and Network Architects | 1.0% | $43.21 | 6,441 | 7,168 | 11.3% | 727 | 950 | 1,680 |
| Environmental Engineers | 1.0% | $37.87 | 431 | 490 | 13.7% | 59 | 100 | 160 |
| Telemarketers | 0.9% | $11.87 | 5,398 | 5,535 | 2.5% | 137 | 1,150 | 1,290 |
| Laborers, Freight and Material Movers, Hand | 0.9% | $12.85 | 31,471 | 35,872 | 14.0% | 4,401 | 10,060 | 14,460 |
| Training and Development Specialists | 0.8% | $27.20 | 4,453 | 5,470 | 22.8% | 1,017 | 750 | 1,770 |
| Source: Bureau of Labor Statistics, DEED Occupation Employment and Wage Statistics (OES); DEED 2010-2020 Employment Projections | ||||||||
Twenty of the 25 occupations in demand in the consulting sector earn a higher median hourly wage than the total of all occupations, especially those requiring postsecondary education. To that end, 16 of the 25 occupations require at least some college experience, including 13 that require at least a bachelor's degree.
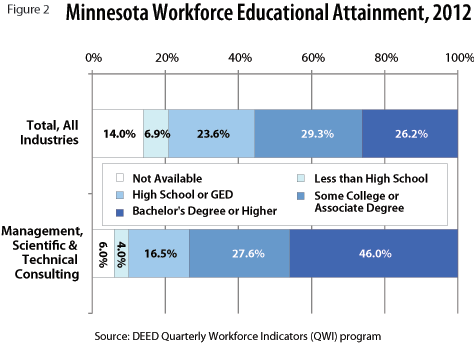
DEED's Quarterly Workforce Indicators program shows that nearly three-fourths of the workforce in the Management, Scientific, and Technical Consulting Services has at least some college experience, including nearly half who have bachelor's degrees or higher. That was nearly double the rate of workers with bachelor's degrees or higher in the total of all industries (Figure 2).

Consulting workers were also much more likely to be in their prime working years, from 25 to 54 years of age. Only 6 percent of the consulting services workforce is under 25 years of age, compared to 14 percent in the total of all industries in Minnesota. Instead, more than three-fourths of workers in the Management, Scientific, and Technical Consulting Services sector were in their prime working years, as compared to two-thirds of workers in the total of all industries.
However, over the last decade, the number of younger workers has essentially held steady while the number of workers 55 years and over more than doubled. Moving forward, consulting seems to be a great fit for the baby boom generation - the work often requires expertise built up over a career, is typically not physically demanding, pays well, and allows almost everyone with specialized skills to start their own business. Finally, the workforce was evenly split between males and females.
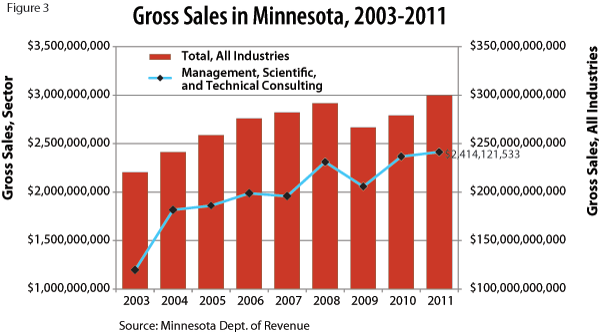
According to annual sales and use tax statistics from the Minnesota Department of Revenue, gross sales in Management, Scientific, and Technical Services surpassed $2.4 billion in 2011 and have grown nearly three times as fast as the total of all industries over the last decade. While gross sales in the state climbed a solid 36 percent, from $220 billion in 2003 to $300 billion in 2011, gross sales more than doubled in Management, Scientific, and Technical Consulting, jumping from $1.2 billion in 2003 to $2.4 billion in 2011 (Figure 3).

After seeing tremendous growth in the last decade, the Management, Scientific, and Technical Consulting Services sector is expected to see rapid growth in the next decade as well. According to DEED's 2010 to 2020 Employment Outlook tool, the consulting sector is projected to grow 43.6 percent from 2010 to 2020, an increase of 5,768 jobs. That is three times faster than the total of all industries (Table 3).
| Minnesota Employment Projections, 2010 to 2020 | |||||
|---|---|---|---|---|---|
| Industry | NAICS Code | Estimated Employment 2010 | Projected Employment 2020 | Percent Change 2010 - 2020 | Numeric Change 2010 - 2020 |
| Total, All Industries | 0 | 2,830,000 | 3,198,000 | +13.0% | +368,000 |
| Professional and Technical Services | 54 | 123,296 | 148,100 | +20.1% | +24,804 |
| Management and Technical Consulting Services | 5416 | 13,232 | 19,000 | +43.6% | +5,768 |
| Source: DEED 2010-2020 Employment Outlook | |||||
While the state as a whole is expected to see rapid growth in the consulting industry, it is almost completely concentrated in the 7-county Twin Cities region. More than 80 percent of the state's consulting jobs are currently located in the Minneapolis-St. Paul metro area, and more than 95 percent of the state's projected job growth is expected to happen there as well.
As businesses rely more and more on outsourcing and contract work, the Management, Scientific, and Technical Consulting Services industry will provide a great opportunity for growth throughout the state. Although employment tenure might be less stable, well-educated workers with specialized skills - especially those in the baby boom generation - may be able to jump into and out of employment and self-employment quickly, depending on the economy.