by Dave Senf
June 2023
The Bureau of Labor Statistics (BLS) plays a crucial role in providing valuable information to policymakers, economists, investors, and job seekers across the United States through a series of economic reports. The Job Openings and Labor Turnover Survey (JOLTS), a relatively new program, provides supplemental detail to the monthly employment and unemployment report. Starting at the end of 2021, JOLTS has provided insights into the dynamics of job openings, turnover rates, and the overall tightness of labor markets. JOLTS monthly estimates have quickly become widely followed by Wall Street analysts and economic forecasters, and combining JOLTS and monthly employment reports gives a more robust view of the labor market each month. In this article, we review what JOLTS contains, explore valuable uses of the JOLTS report, and identify the states with the tightest labor markets based on recent data.
The JOLTS survey isn't the first attempt by the BLS to collect job openings and labor turnover data, as hires and separations data was published from 1954 to 1981. There were even attempts to collect job openings data by occupation (JOLTS data is by industry), but survey costs proved too expensive. Funding for revival of a job openings and turnover survey was secured in 1998 leading to the BLS publishing experimental U.S. JOLTS numbers in 2002, and then official numbers in 2004 (with data back to December 2000).
Since then, national JOLTS numbers have become available across more industries and by establishment size classes (for private employment only). Official U.S. Census regions and state-level JOLTS estimates have been published since 2021 (also dating back to December 2000), but currently cover only total nonfarm employment with no industry or size class breakdown. Seasonally adjusted and unadjusted estimates are reported across all geographic sizes.
The data presented in this article is mostly seasonally adjusted JOLTS data presented as 12-month moving averages or six-month averages to even out the month-to-month volatility in the seasonally adjusted data. JOLTS data, just like employment and unemployment data, is revised annually.
The BLS surveys more than 20,000 businesses and government offices to estimate the numbers of U.S. job openings (vacancies), hires, and separations. Separations are subdivided into three categories: quits, or voluntary resignations; layoffs and discharges; and other separations, which include deaths and retirements. As with other monthly BLS reports (such as the unemployment report), nationwide JOLTS data are updated first, with state-level updates following two weeks later. The monthly report provides data that is two months old when published (JOLTS reports released in May provided estimates for March) unlike the unemployment report, which is lagged by a month. Actual estimates (in the thousands) are published, as are rates.
Rates are calculated by dividing the number of job openings by the sum of total employment and number of job openings, and then multiplying by 100. In essence, this measures the fraction of jobs in the economy that are open but haven't been filled. South Dakota had 27,000 job openings in March while Minnesota had 5.6 times that with 179,000 job openings. But Minnesota's employment base in March was 2,979,200 jobs, or 5.5 times larger than South Dakota's base of 461,700 jobs. Therefore, the valid comparison when assessing relative job openings in the two states is job openings rates.
In March, the rate was 5.5 in South Dakota and 5.7 in Minnesota, which translates to mean that Minnesota had slightly more job openings than South Dakota after adjusting for employment base size. Higher job openings rates imply more jobs to fill after accounting for total employment. Twenty-eight states had higher job openings rates than Minnesota, and five other states had the same rate as Minnesota in March. States with higher job openings rates can be thought of as having stronger demand for labor, since these states have more job openings after factoring in the number of jobs in the states. Virginia and Alaska had the highest rate in March at 7.7 while New York had the lowest at 4.2. However, it is important to note that the job openings rate reveals nothing on the supply of persons who might fill the job openings.
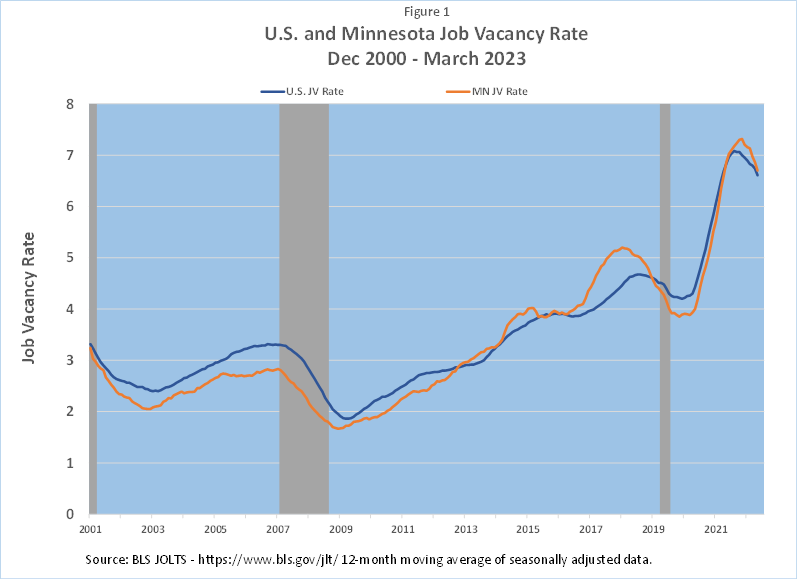
The JOLTS report provides data on the number of job openings across different industries for the U.S., but only for total employment (private and public sector combined) at the state level. This information is valuable for job seekers, as it helps them identify areas of opportunity and make informed decisions regarding career paths. It also serves as an indicator of overall economic health, as more job openings usually indicate a growing economy. As expected, job openings and rates decline during recessions and rise during expansions. Changes in Minnesota's job openings rate over time has closely tracked the peaks and valleys of the U.S. job openings rate.
Minnesota's job openings rate trailed slightly behind the U.S. rate for all of the 2000s, before running slightly above the U.S. rate between 2014 and 2019. Minnesota's rate and then the U.S. began to fall months before the pandemic hit, hinting at weakening labor demand even before the pandemic. But job openings surged in Minnesota and in all corners of the U.S. when the pandemic eased, as businesses reopened and restrictions were lifted, setting off a labor market rebound.
Job openings in Minnesota tripled and were 2.6 times higher nationwide from the trough of the Pandemic Recession to the peak a few months ago. The extraordinary high level of demand for workers over the last two years is underscored by how much higher job openings have been over the last year compare to the last peak in 2018 (see Figure 1).

What explains the spike in job openings? The recovery from the Pandemic Recession was relatively rapid as the federal government pandemic relief spending boosted household income, which boosted consumer spending and sparked the speedy rebound. Employment recovered to pre-recession levels in less than three years, compared to seven years following the Great Recession. As detailed in past articles, labor demand was much stronger after the Pandemic Recession, helping to send job openings soaring.
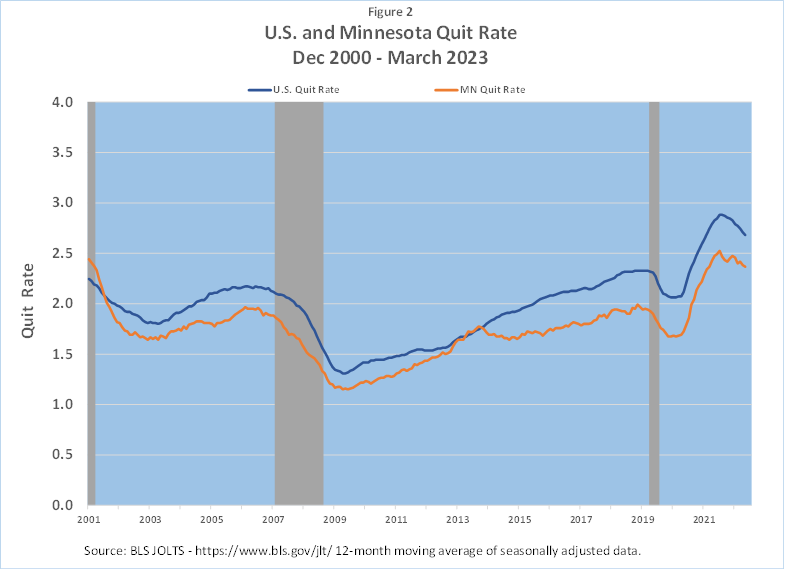
The "Great Resignation" (also referred to as the "Big Quit" or "Great Reshuffle") also played a part in the spike. The Great Resignation, which gained momentum in 2021 but has eased somewhat in 2023, can be described as the occurrence of workers voluntarily leaving their jobs in unprecedented numbers. The quit rate from JOLTS displays the steep jump in workers who voluntarily left their jobs for greener pastures (see Figure 2). The quit rate in Minnesota, as is the norm during recessions, dipped when the Pandemic Recession arrived and then increased when the job market rebound accelerated. As job openings jumped, workers felt more confident of being able to find better paying and higher quality positions. The increased job hopping, as evidenced by the uptick in the quit rate, added to the rise in job openings.

High rates of quits can indicate higher employee confidence about better opportunities for career advancement, while increasing layoffs may suggest economic instability on the horizon. These insights can help shape policies that promote workforce development and stability. JOLTS data reporting on hires, quits, and layoffs allows economists and policymakers to gauge the level of labor market churn.
The slow growth in the labor force may also being contributing to expanded job openings, as employers struggled with a smaller pool of available workers and found open positions took longer than in the past to fill. A job opening that took three months to fill five years ago may now take six months to fill now. The extra three months required to fill the openings, used as a hypothetical example here, add to job openings totals.
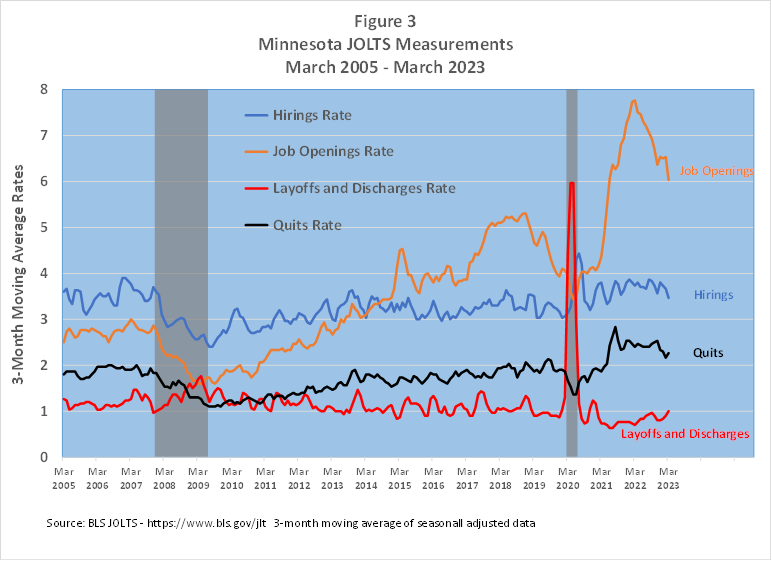
Tracking four Minnesota JOLTS measures through time provides multiple insights into the state's job churn and where the economy is headed. Prior to the Great Recession from 2007-2009, the first indicator to show some significant change was the layoffs rate, as it was already starting to climb in the middle of 2006. But the layoff rate reversed directions in the middle of 2007, before sharply climbing once the Great Recession hit.
The hirings rate first started retreating in late 2006, with the job openings rate doing the same a few months later. The quits rate was somewhat steady through 2007 before heading downwards when the Great Recession arrived in Minnesota. All of the rates continued to move in the expected direction until the recession was over.
Recent changes in the same rates show that the job openings rate peaked a year ago, has been slipping since, but remains firmly higher than before the pandemic. The hirings rate has been relatively flat over the last year and is running modestly above the period prior to the Pandemic Recession . The quits rate peaked before the job openings rate peaked and has continued to trend downwards, but is also modestly higher than pre-pandemic rates. The layoffs rate has been inching up since the middle of 2021, but is still below its historical average during non-recession periods (see Figure 3).

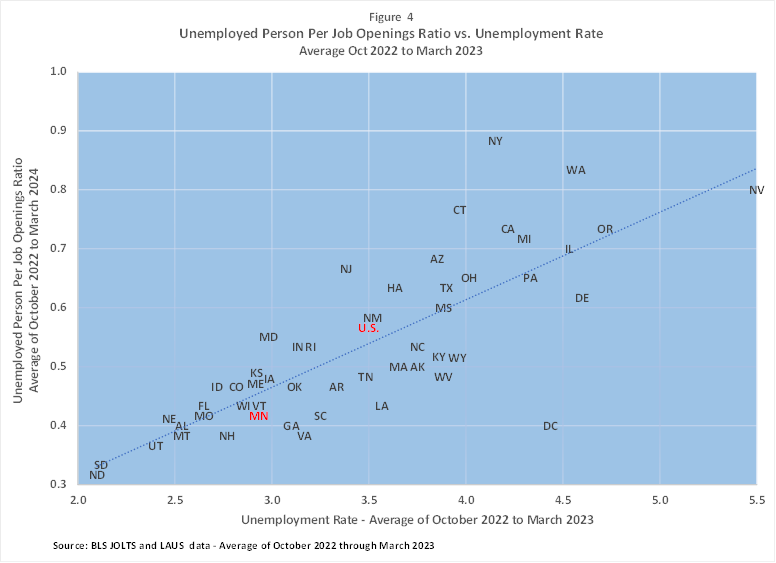
Also available in the JOLTS data is the ratio of unemployed workers to job openings (UO rate) each month (see Figure 4). A UO rate of 1 translates into one unemployed worker per one job opening. A UO rate below 1 indicates that there are more job openings than unemployed workers, while a UO rate above 1 indicates that there are more unemployed workers than job openings. The lower the UO rate, the tighter the job market.
South and North Dakota have the lowest UO rates at 0.3, which translates into 3 job openings for every unemployed worker (or for every job opening, 0.3 unemployed workers exist). New York has the highest UO rate at 0.9, meaning that for every unemployed worker there are 1.1 job openings (or for every job opening, 0.9 unemployed workers exist). The UO rate was 0.6 for the U.S. and for Minnesota was 0.4, leaving us among the tightest labor markets in the country.
Minnesota's average UO rate over the 23 years of data is 1.8, with the lowest rate of 0.2 recorded in July 2022 and the highest rate of 5.9 in August 2009. The lowest rate for the U.S. as a whole was 0.5, first reported in December of 2021, while the highest rate was 6.5 in July 2009. The Great Recession officially ended in June 2009, thus the highest UO rates for Minnesota and U.S. were both recorded right around then.
When measured by the unemployment rate, Minnesota's job market tightness was tied with Vermont for the 14th tightest; but was tied for 11th tightest along with Missouri and South Carolina when judged by UO rates. Minnesota reported the 14th lowest unemployment rate and 16th lowest UO rate when using only the March 2023 rates. If nitpicking over relative tightness of state labor markets, then perhaps Minnesota's labor market is a tad tighter than South Carolina and Vermont, but not as tight as Missouri.

The unemployed workers to job openings ratio (UO ratio) is calculated based on more information (job openings) than the unemployment rate, but the correlation between UO and unemployment rates is very strong. Evaluating a region's labor market tightness over time or to other regions in most cases would tell similar stories, whether UO or unemployment rates are utilized. A tight labor market typically indicates low unemployment and low UO rates and a higher demand for workers, creating favorable conditions for job seekers.
Unemployed workers are a narrow measure of potential labor supply, however. The headline unemployment rate includes only those who are activity seeking a job. The potential labor supply is larger than the headline number of unemployed workers and is measured by alternative unemployment rates. The alternative unemployment numbers include marginally attached workers (persons not in the labor force, who want and are available for work, but haven't looked for a job during the previous four weeks for any reason) and discouraged workers (persons not in the labor force, who want and are available for work, and have looked for a job sometime in the prior 12 months), who would expand the labor supply if they joined the labor force.
A high labor force participation rate (the number of people in the labor force as a percentage of the civilian noninstitutional population) implies lower numbers of marginal and discouraged workers. Minnesota has the 7th highest labor force participation rate (LFPR) at 68.1% compared to the 62.8% rate in Missouri. If Missouri increased its LFPR to Minnesota's level, labor supply in Missouri would increase, which would lessen the labor market tightness in that state. In other words, Minnesota's labor market tightness may be higher than in Missouri since Minnesota has a lower percent of its population that isn't already in the labor force.
In sum, the Bureau of Labor Statistics' Job Openings and Labor Turnover Survey (JOLTS) offers valuable insights into the labor market, providing crucial information for job seekers, policymakers, and economists. By examining job openings, labor turnover rates, and labor market tightness, stakeholders can make informed decisions, implement effective policies, and gauge the economic health of different regions. Understanding the JOLTS report and monitoring labor market trends can help individuals navigate the ever-changing job market and organizations plan for workforce needs accordingly.
View this JOLTS data visualization to compare U.S. states by rates, separation types and more.
1For more information on the scope of JOLTS data.
2The unemployment and UO rates used in Figure 4 are six-month averages (October 2022 to March 2023). Use of single month rates to compare job market tightness alter rankings a bit but the changes are minimal.