by Rachel Vilsack
January 2013
It's frequently reported that the majority (70 to 80 percent) of job openings are never advertised by employers. This is referred to as the hidden job market, suggesting that these jobs would be "hidden" from a job seeker only looking for opportunities posted online or in printed help-wanted ads. These figures are often cited as a reason why job seekers should engage in networking activities.1 Using numerous measures of job openings and counts of workers newly hired to a business, we can explore the prevalence of the hidden job market in the Twin Cities. What evidence is there on how many job openings in the Twin Cities labor market are not readily posted online?
There are three distinct and readily available measures of regional job openings:
To begin, DEED's Labor Market Information Office has captured the quantitative and qualitative features of job openings on its semi-annual Job Vacancy Survey (JVS) for the past 12 years. This stratified sample of about 10,000 firms covered by Minnesota's Unemployment Insurance (UI) program in the 13 regions of Minnesota is conducted during the second and fourth quarters of each year. It is a point-in-time survey, meaning that firms are asked about their job vacancies at the time they receive the survey, not the accumulation of openings over the three months of the quarter.
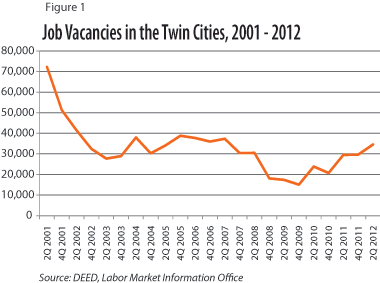
Businesses are asked to include positions for which they are actively recruiting and to exclude job vacancies for positions like outside contractors and consultants, which they would not consider to be employees. Job vacancies captured then are positions that would be covered by the UI program. Firms excluded from the sampling process include private households, personnel service industry establishments like temporary help wanted or staffing agencies, and businesses with no employees. Figure 1 highlights job vacancies in the Twin Cities. Regional openings peaked in second quarter 2001 at 72,290 and bottomed out in fourth quarter 2009 at 15,037, following the official end of the Great Recession. Overall, regional job vacancies fell by half during the recession. More recently vacancies continued to increase in 2011 and 2012 with some of the largest year-over-year growth rates for job vacancies on record.

Another source to measure job openings is MinnesotaWorks.net (MNW), the state's no-fee online job bank for employers and job seekers. To post jobs, a business must create an account which is approved after being verified by the firm's State Employer Tax Number or Federal Identification Number. This ensures that the business pays withholding taxes on its employees, including Unemployment Insurance. A business also agrees to conditions that they are not soliciting business opportunities (including independent contractors paid with 1099s) or posting a job when there is no current opening in Minnesota, among other conditions.
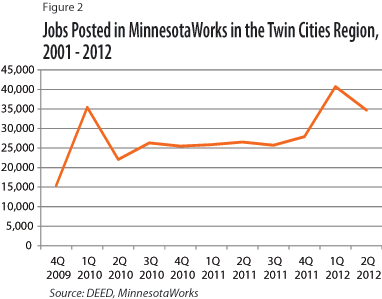
Figure 2 provides a count of Twin Cities regional job openings posted on MNW over the past several years. Counts of openings trend closely with those captured by the JVS, including during fourth quarter 2009 that saw a low JVS count (15,037) and a similar number of jobs posted on MNW (15,444). For second quarter 2012 regional openings were also closely aligned: the JVS captured 34,587 vacancies while 34,715 jobs were posted on MNW.

It is surprising how similar the number of jobs opportunities is between the two measures. If we assume that the majority of openings are not advertised by employers, then we would expect the JVS to record more vacancies than the number posted on MNW, which is advertising openings. Yet in only three of the six quarters for which data are available were counts of job openings in the Twin Cities higher on the JVS than on MNW.
We should assume, however, that the openings recorded on the JVS or posted on MNW do not represent the full number of opportunities available for job seekers, as both explicitly exclude jobs for consultants or contractors, and the JVS further omits sampling the personnel service industry. But these measures make a good comparison as they illustrate job openings from the same relative pool of businesses, namely those who participate in the state's Unemployment Insurance program.
Finally, the Conference Board maintains a Help Wanted On-Line (HWOL) data series, which scrapes 16,000 online job boards, including corporate sites, and measures unduplicated job ads for state and Metropolitan Statistical Areas (MSAs). Monthly Minnesota and Minneapolis-St. Paul MSA figures are released along with seasonal and non-seasonal adjustments, and data are revised annually. Historical time series for MSAs are not readily available.
As of November 2012, the Minneapolis-St. Paul MSA recorded 83,300 total ads.2 The region was also one of 13 across the U.S. that saw online ads increase by 100 percent or more since the end of the recession in June 2009. The Minneapolis-St. Paul region also ranks fourth nationwide with a 1.23 supply/demand rate, measuring unemployed workers for every advertised vacancy.3
Counts of online job openings can be subject to error. It is not clear if a posting is for an immediate or near-term job, or a way for the employer to build up an applicant pool for future opportunities. A recent analysis by a researcher at the Federal Reserve Bank of San Francisco found that HWOL captured more ads than the openings identified in the national Job Openings and Labor Turnover Survey (JOLTS) conducted by the Bureau of Labor Statistics and posited that HWOL either has a less strict definition of a job opening or that - despite attempts to count unduplicated ads - multiple postings were really for the same vacancy.4
Monster Worldwide, Inc. also produces a monthly Monster Employment Index aimed at presenting a snapshot of employer online recruitment activity nationwide and for the 28 largest U.S. metro markets. Counts of online postings are not available, but the Minneapolis area showed a 2 percent year-over-year growth in November 2012 with opportunities in installation, repair, and maintenance, in architecture and engineering, and in life, physical, and social science occupations showing the strongest growth.5 Minneapolis ranked among the five lowest growth metro markets in November 2012.
HWOL and Monster Employment Index often show differing trends at a statewide level. DEED's Labor Market Information Office tracks these online help-wanted advertising measures in the Minnesota Economic Indicators section of the monthly Minnesota Employment Review publication. Recent analysis noted that "[s]ince the state's share of national wage and salary employment is around 2 percent, the 2.5 percent share of national online ads suggest that labor demand in Minnesota is stronger than nationwide. Online help-wanted levels for the state suggest that job growth will continue in Minnesota at least through the rest of the year and into early 2013."6
The U.S. Census Bureau's Quarterly Workforce Indicators data capture a measure of new hires or the total number of accessions that were also not employed with any firm covered by UI during the previous four quarters. This quarterly measure of new hires then provides an estimated number of workers who started a job at a firm that they had not held within the past year. New hires do not include self-employed workers or independent contractors, as these workers are generally not covered under state Unemployment Insurance programs. It would also not include a measure of people who move from one job to another within the same company.
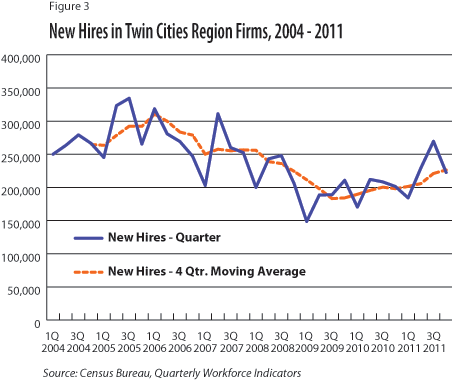
Figure 3 shows quarterly new hires in Twin Cities' region firms between 2004 and 2011. Averaging anywhere from a high of 310,500 new hires in first quarter 2006 to a low of 183,100 new hires in third quarter 2009, these numbers are substantially larger than JVS and MNW job openings. During the Great Recession, the number of new hires fell by 16.5 percent.

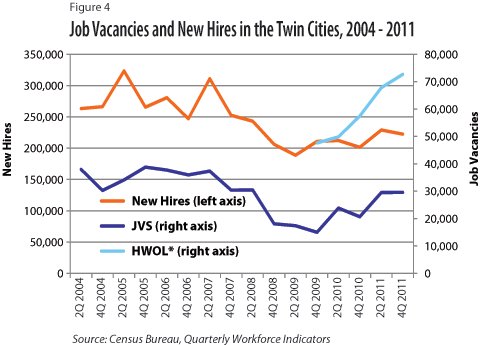
Figure 4 brings together counts of job openings and new hires for the Twin Cities region. Comparing HWOL counts to new hires reveals that only 23.7 to 33.7 percent of opportunities, or new employees to a Twin Cities firm, were posted online.7 Correspondingly, up to 75 percent of new hires to regional firms were "hidden."

There may be good reasons why employers don't actively recruit publicly or keep job opportunities hidden. Firms may first rely on referrals from existing employees to fill open positions which translate into hires. According to a 2012 CareerXroads survey, 28 percent of external sources of hires were through referrals.8 Recruiters increasingly use social media sites like LinkedIn, Facebook and Twitter to find potential employees. Three out of four recruiters surveyed by Jobvite in 2012 hired candidates through social networks.
This analysis can also give us a sense of why point-in-time estimates of job vacancies might not correspond to new hires. The hiring cycle - from a firm's initial idea that a job is necessary to the creation of a position description, etc. - starts well before a job is posted, whether that be online or even internal. There are many opportunities along this cycle to find, recruit, or hire someone before an opportunity ever becomes visible for us either through an online ad or captured on a survey.9
1Interestingly, it's also often reported that 80 percent of jobs are found through networking. This statistic is almost always attributed to a Bureau of Labor Statistics (BLS) report that I have never been able to confirm.
2The Conference Board, Help Wanted OnLine Data Series. Numbers presented are seasonally adjusted.
3The supply/demand rate is for October 2012. Three MSAs ranked above Minneapolis-St. Paul: Washington DC, Oklahoma City, and Salt Lake City.
4Hobijn, Bart. "The Industry-Occupation Mix of U.S. Job Openings and Hires." Federal Reserve Bank of San Francisco Working Paper Series, July 2010. Accessed December 28, 2012.
5Monster Employment Index - Minneapolis. Accessed December 31, 2012.
6Senf, Dave. Minnesota Economic Indicators, Minnesota Employment Review, October 2012.
7HWOL data presented here are limited and represent not seasonally adjusted numbers as reported in monthly press releases from the Conference Board.
8CareerXroads, Sources of Hire Survey.
9Jobvite, 2012 Social Recruitment Survey.