by Dave Senf
February 2014
Note: All data except for Minnesota's PMI have been seasonally adjusted. See the feature article in the Minnesota Employment Review, May 2010, for more information on the Minnesota Index.
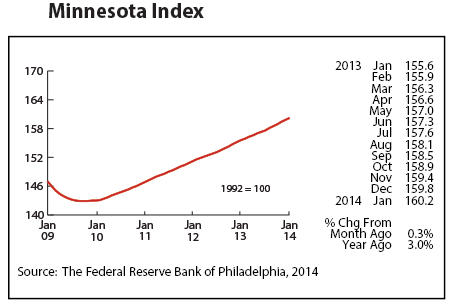
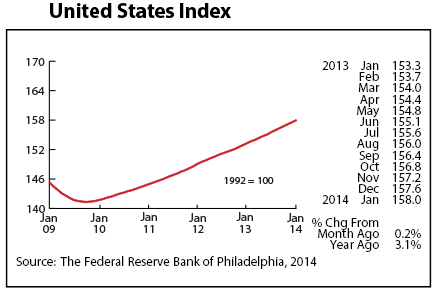
The Minnesota Index advanced 0.3 percent for the sixth month in a row in January. The index, revised this month to incorporate the annual bench-marked employment data, was up 3.0 percent over the year. The slowdown the index was showing at the end of 2013 was erased by the revisions, as anticipated. The U.S. index increased 0.2 percent for the second straight month in January and was up 3.1 percent from a year ago.
Both of the indices bottomed out in October 2009 and have been gradually advancing since. The Minnesota index has increased 12.1 percent while the U.S. index has advanced 11.8 percent. That averages out to an annual gain of roughly 2.8 percent for both Minnesota and the U.S. Minnesota's index has averaged a 3.3 percent annual gain over the 35-year history of the index when recession months are excluded. The national index has averaged 2.9 percent annually over the same period when recession months are excluded.
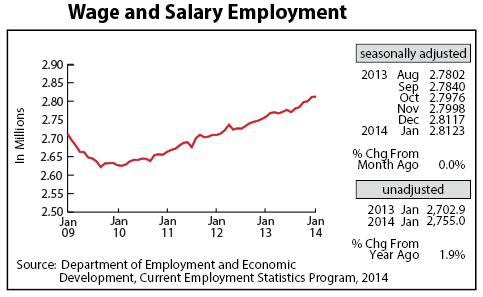
Minnesota's adjusted Wage and Salary Employment barely changed in January, inching up 600 jobs. Private Sector employment increased 900 jobs while Public Sector employment dropped 300. Trade, Transportation, and Utilities cut the most jobs, laying off 3,200 workers. Financial Activities and Information also decreased their payroll by more than 1,000 jobs. Hiring was robust in Leisure and Hospitality, Manufacturing, and Educational and Health Services.
Revised job data shows that job growth, on an annual average basis, was 1.7 percent in 2013, up slightly from 1.6 percent in 2012. Employment growth in the state last year matched the U.S. rate. The state added 47,300 jobs in 2011, 42,100 in 2012, and 46,400 in 2013 when measured on an annual average basis. This is the strongest three-year span of job growth since 1998-2000. Jobs added between 1998-2000 averaged 61,600 per year compared to 45,400 over the last three years.
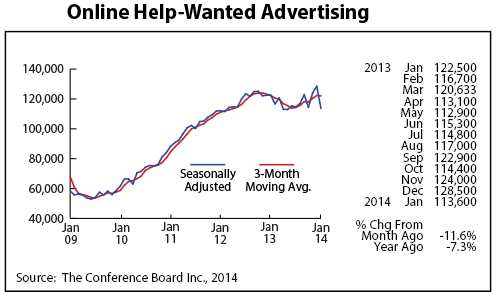
Minnesota's adjusted online Help-Wanted Ads plunged 11.6 percent in January, but the decrease was from a revision in how the series is calculated rather than an actual fall off in ad levels. There is no reason to believe that the hiring pace has slowed. Soon-to-be-released Job Vacancy Survey numbers for the 4th quarter of 2013 show that labor demand continues to remain steady in Minnesota.
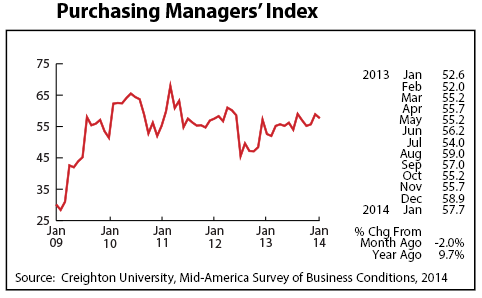
Minnesota's Purchasing Managers' Index (PMI) slipped slightly last month, dipping to 57.7. The reading suggests that Minnesota Manufacturing activity will continue to expand at a moderate pace during the first half of 2014. Factories should continue to add workers as the employment component of the PMI continues to come in above 50.
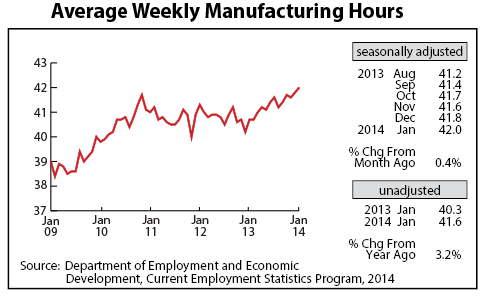
Adjusted Manufacturing Hours climbed strongly for the second straight month in January jumping to 42.0 hours. The factory workweek hasn't been this long since March 2007. The robust workweek is another indicator that Minnesota's manufacturers are enjoying solid growth.
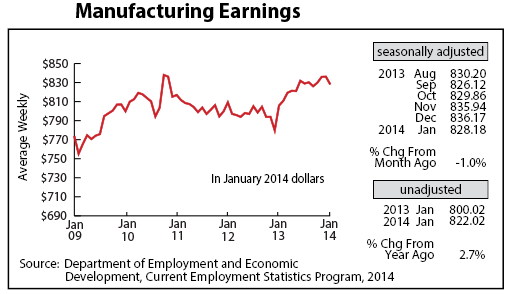
Manufacturing Earnings dipped in January falling off to $828.18. Factory paychecks, however, continue to run ahead of last year's paychecks in real terms.
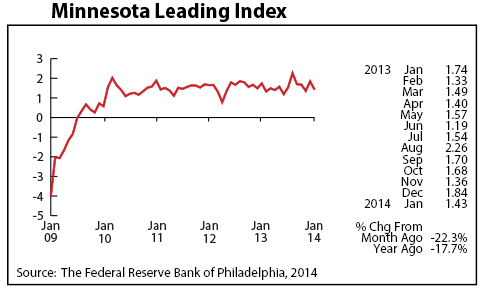
The Minnesota Leading Index, which was recalibrated with revised employment data for 2013, stumbled in January tailing off to 1.43. This reading predicts that Minnesota's economy will grow by 1.4 percent over the next six months, which is a 2.8 percent annual pace. The index readings during the last half of 2013 were pointing toward a noticeable slowdown in early 2014. January's reading is now more nearly consistent with other indicators, pointing toward steady economic expansion during the first half of 2014.
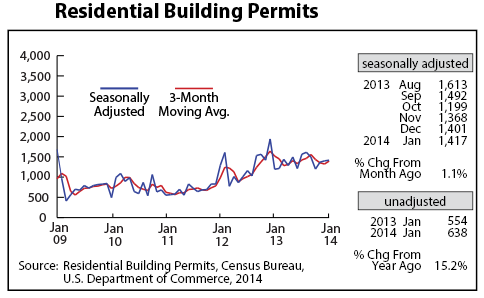
Adjusted Residential Building Permits headed up for the third consecutive month starting the year with 1,417 permits in January. Minnesota's home-building recovery is headed into its fourth year after hitting bottom in 2009-10. The recovery, which has been bumpy, is expected to pick up some momentum in 2014 but will remain moderate compared to historical norms. Residential construction employment, which increased 8.7 percent last year, should have another strong year of job growth.
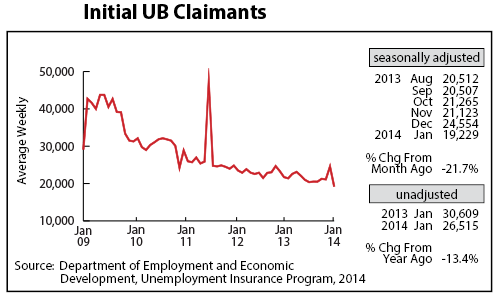
Adjusted Initial Claims for Unemployment Benefits (UB), after surging in December, plunged in January to 19,229, the lowest monthly total since December 2000. January's level may be revised slightly upward when February numbers are released, but January's low level is a strong indicator that Minnesota's job growth will remain solid during the first half of 2014. Job growth is likely to stay solid throughout the year, gradually pushing Minnesota's unemployment rate down. The improving job market is likely to encourage some of the state's discouraged workers back into the labor force, which will slow the decline in the unemployment rate.