by Dave Senf
March 2018
Note: All data except for Minnesota’s PMI have been seasonally adjusted. See the feature article in the Minnesota Employment Review, May 2010, for more information on the Minnesota Index.
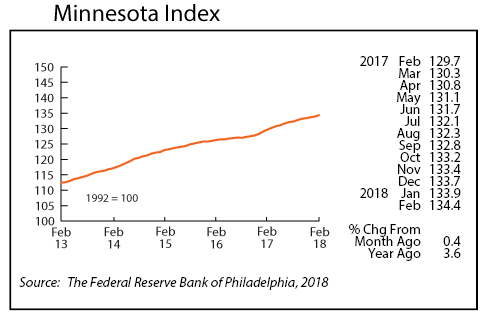
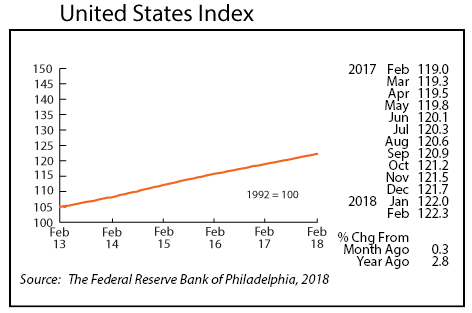
The Minnesota Index advanced 0.4 percent in February, climbing to 134.4. The uptick indicates that Minnesota’s economy accelerated in February. The U.S. economy also picked up speed in February, advancing 0.3 percent. The U.S. index was up 2.8 percent from last February while Minnesota’s index is up 3.6 percent over the same period.
Minnesota’s adjusted Wage and Salary Employment declined by 1,300 jobs in February after a revised gain of 4,900 jobs in January. Most of February’s job drop was in the public sector which cut payroll numbers by 1,100. Private sector jobs decreased by 200 positions with layoffs heaviest in Professional and Business Services. Hiring was strong in Leisure and Hospitality. Goods-producing employment rose for the sixth straight month which hasn’t occurred since mid-2015. Construction employment expanded for the seventh month in a row. Service-providing employment, which includes government employment, was down 2,400, offsetting the 1,100 gain in goods-producing jobs.
Minnesota’s unadjusted over-the-year job growth stayed at 0.8 percent for the second month in a row. Over-the-year U.S. job growth in February rose to 1.7 percent. The 0.8 to 1.7 percent monthly gap was the largest for the state since January 2007. Minnesota’s annual average job growth for 2017 was revised significantly downward during annual benchmarking to 1.3 percent, the same rate as in 2016. Minnesota’s annual average job growth lagged national job growth for the fourth straight year but by less than in previous years.
The recent tailing off in Minnesota’s job growth may be more related to the state’s tightening labor market than a decline in labor demand. Employers just can’t find workers to fill their job openings. Minnesota’s 1.3 percent annual average job growth in 2017 was more than double neighboring states. The annual average job growth rate in 2017 for Iowa was 0.1 percent, -0.9 percent in North Dakota, 0.5 percent in South Dakota, and 0.6 percent in Wisconsin. Annual average unemployment in 2017 was 3.1 in Iowa, 3.5 in Minnesota, 2.6 in North Dakota, 3.3 percent in South Dakota, and 3.3 percent in Wisconsin.
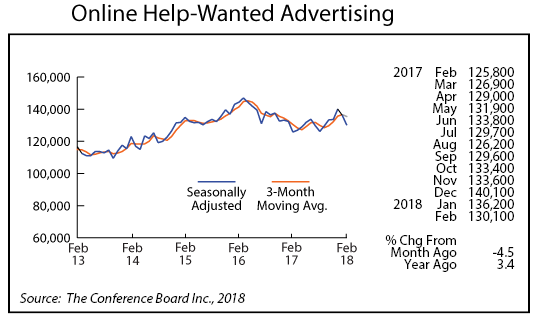
Online Help-Wanted Ads fell for the second straight month, slipping to 130,100 in February. That is the lowest level since last September but still high enough to be consistent with a robust level of demand for workers. Online job postings declined 4.5 percent in Minnesota while nationwide job postings dipped 3.8 percent in February. The Conference Board, in addition to compiling and publishing online help-wanted ads, also publishes a supply/demand ratio for each state comparing the number of unemployed workers to the number of online job postings. The national rate was 1.36 or 1.36 unemployed workers for each online help-wanted ad in February. Twelve states had a ratio below one including Minnesota with a supply/demand ratio of 0.66, the thirds lowest rate behind only Colorado and Hawaii
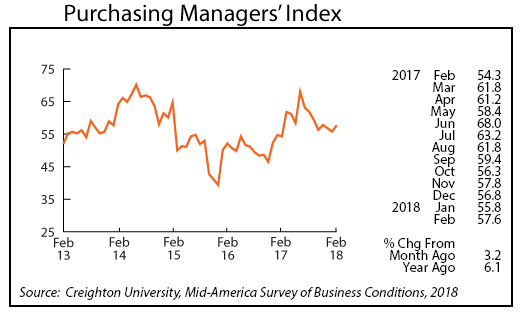
Minnesota’s Purchasing Managers’ Index (PMI) climbed for the first time in three months, increasing to 57.6. The index has been relatively flat over the last five months. suggesting that Minnesota’s manufacturing sector is expanding at a steady rate. The corresponding national index increased to 60.8 in February while the Mid-American index, which includes Minnesota and eight other states, rose to 59.7.
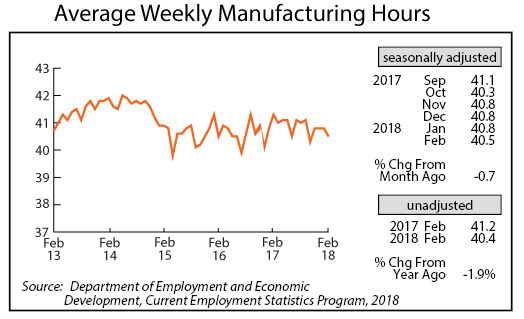
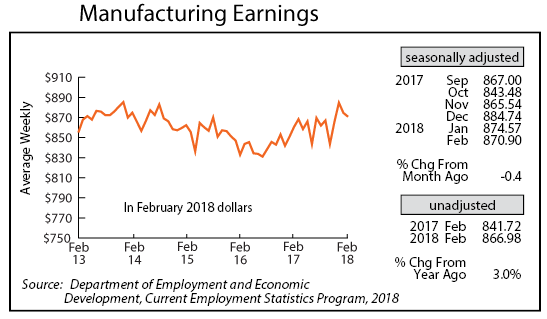
Adjusted average weekly Manufacturing Hours, after hovering at 40.8 hours during the previous three months, retreated to 40.5 hours in February. Average weekly Manufacturing Earnings dipped for the second month in a row to $866.98. Factory paychecks, adjusted for inflation and seasonality, were up 3 percent from a year ago.
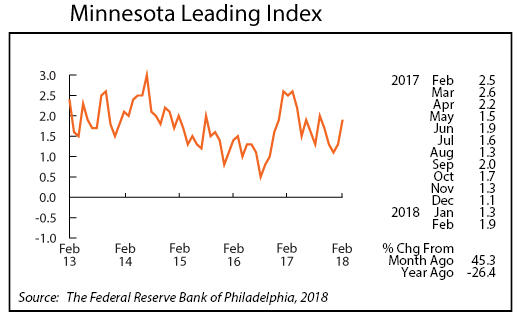
The Minnesota Leading Index spiked to 1.9 in February, its highest reading since 2.0 last September. The average reading over the 36 years of the series is 1.5, so the 1.9 suggests that Minnesota’s economy will be growing at a faster than average rate during the first part of 2018.
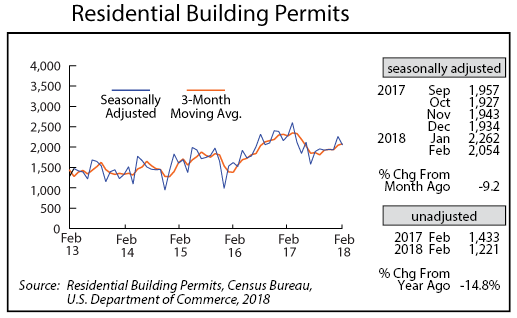
Adjusted Residential Building Permits dropped slightly in February to 2,054. The level of home-building permits was strong during the first half of 2017 and then waned during the second half. Unadjusted permit numbers were up 12 percent in January from a year ago and down 15 percent in February.
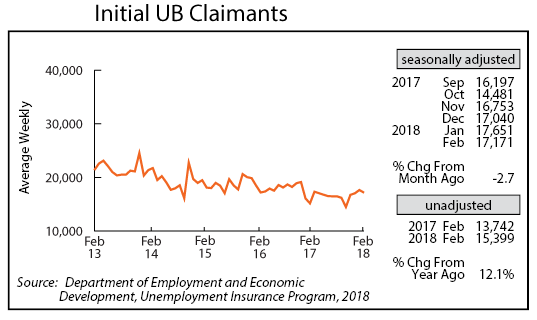
Adjusted Initial Claims for Unemployment Benefits (UB) inched down in February after three months of increasing. Initial claims were above a year ago for the second straight month, but the claims level remains extremely low, reflecting how tight the labor market has become. Employers are reluctant to let workers go since finding qualified workers has become a major problem. Minnesota’s unemployment rate fell to 3.2 in February, the lowest rate since March 2000. The 3.5 percent annual average unemployment rate recorded last year is the fifth lowest going back to 1976. Only the four year stretch from 1997 to 2000 had lower average annual unemployment rates.
