by Mark Schultz and Cameron Macht
June 2019
Job seeker-per-vacancy ratio is the lowest it's been since the Job Vacancy Survey began – and unemployment is below 3.0 percent.
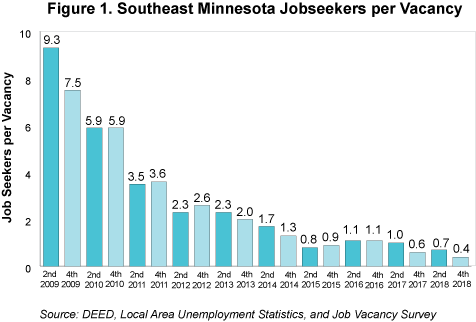
Like the rest of the state, Southeast Minnesota is squeezed by a tight labor market. After employers posted a record number of job vacancies in the fourth quarter of 2018, the region had almost three times as many open jobs as it had unemployed workers available to fill them. Employers reported 18,505 job vacancies in fourth quarter 2018 compared to just 6,537 unemployed workers. While it's nice to see so few Southeast residents unemployed, many companies are struggling to fill their job openings (Figure 1).

The region's job seeker per vacancy ratio of 0.4 to 1 is not only the lowest of the six planning regions in the state, it is also the lowest Southeast has experienced since the Job Vacancy Survey began in 2001. While the region's labor force has grown by nearly 20,000 workers since 2001, the current estimate of about 283,500 total workers means the region's unemployment rate is now well below 3.0 percent.
For employers, it looks as if this problem will continue in upcoming years. According to Minnesota State Demographic Center projections, the region's labor force may see a decline of over 6,000 participants from 2020 to 2030. Much of the drop is due to an aging population, with the largest loss anticipated for workers between 55 and 64. In fact, this loss is larger than the total gains expected in all other age groups combined during this time period (Table 1).
| Table 1. Southeast Minnesota Labor Force Projections, 2020-2030 | ||||
|---|---|---|---|---|
| Age Group | 2020 Labor Force | 2030 Labor Force | 2020-2030 Change in Labor Force | |
| 16 to 19 years | 17,145 | 15,434 | -1,711 | -10.0% |
| 20 to 24 years | 36,676 | 38,654 | 1,978 | 5.4% |
| 25 to 44 years | 99,819 | 102,497 | 2,678 | 2.7% |
| 45 to 54 years | 50,647 | 49,536 | -1,111 | -2.2% |
| 55 to 64 years | 53,253 | 40,644 | -12,609 | -23.7% |
| 65 to 74 years | 15,213 | 18,442 | 3,228 | 21.2% |
| 75 years & over | 2,898 | 4,199 | 1,300 | 44.9% |
| Total Labor Force | 275,651 | 269,404 | -6,247 | -2.3% |
| Source: Minnesota State Demographic Center | ||||
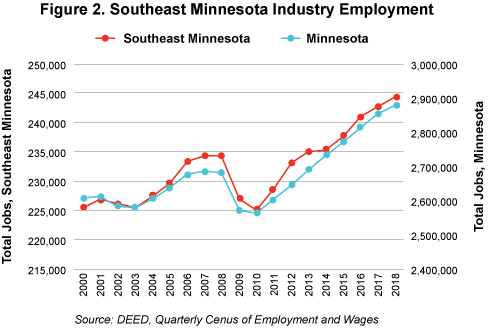
Save for drops during recessionary periods, the region has seen significant employment growth since 2000, with the number of jobs increasing by 18,910 between 2000 and 2018. Almost half of those jobs have been added in the past five years, with employment climbing 3.9 percent from 2013 to 2018. While not quite as fast as the state, the region's economy is expanding steadily (Figure 2).

Since 2013, the largest job gains were in health care and social assistance (+5,108 jobs), manufacturing (+1,864 jobs), and accommodation and food services (+1,446 jobs); while the fastest growth was in construction, which increased by 15.7 percent. In sum, 12 of the 20 main industry sectors saw employment growth from 2013 to 2018.
Unfortunately, eight industry sectors lost jobs over this time period, with the most notable cuts in administrative support and waste management services which includes temporary staffing agencies. However, some of these losses have turned into employment gains in industries that typically rely on personnel services, especially manufacturing. Other industries that suffered declines include retail trade, professional and technical services, wholesale trade, finance and insurance, and utilities (Table 2).
| Table 2. Southeast Minnesota Industry Employment, 2018 | ||||||
|---|---|---|---|---|---|---|
| NAICS Industry Title | 2018 Annual Data | 2013-2018 | ||||
| Number of Firms | Number of Jobs | Total Payroll ($1,000s) | Average Annual Wage | Change in Jobs | Percent Change | |
| Total, All Industries | 12,552 | 244,297 | $12,771,391 | $52,278 | +9,137 | +3.9% |
| Health Care and Social Assistance | 1,338 | 65,235 | $4,672,938 | $71,632 | +5,108 | +8.5% |
| Manufacturing | 674 | 38,492 | $2,280,207 | $59,238 | +1,864 | +5.1% |
| Retail Trade | 1,717 | 26,587 | $713,416 | $26,833 | -539 | -2.0% |
| Accommodation and Food Services | 1,106 | 19,677 | $347,582 | $17,664 | +1,446 | +7.9% |
| Educational Services | 261 | 19,651 | $897,476 | $45,671 | +857 | +4.6% |
| Public Administration | 374 | 10,853 | $587,389 | $54,122 | +625 | +6.1% |
| Construction | 1,453 | 9,525 | $542,206 | $56,924 | +1,293 | +15.7% |
| Admin. Support and Waste Mgmt. Services. | 498 | 7,846 | $287,660 | $36,663 | -1,567 | -16.6% |
| Transportation and Warehousing | 587 | 7,608 | $343,515 | $45,152 | +285 | +3.9% |
| Wholesale Trade | 511 | 6,671 | $437,934 | $65,647 | -177 | -2.6% |
| Other Services | 1,284 | 6,410 | $172,486 | $26,909 | +40 | +0.6% |
| Finance and Insurance | 661 | 5,783 | $419,914 | $72,612 | -173 | -2.9% |
| Arts, Entertainment, and Recreation | 244 | 4,010 | $99,711 | $24,866 | +482 | +13.7% |
| Professional and Technical Services | 771 | 3,583 | $195,585 | $54,587 | -290 | -7.5% |
| Information | 189 | 3,389 | $163,761 | $48,321 | -54 | -1.6% |
| Agriculture, Forestry, Fish and Hunting | 392 | 3,080 | $104,443 | $33,910 | +71 | +2.4% |
| Management of Companies | 51 | 2,941 | $288,555 | $98,114 | +108 | +3.8% |
| Real Estate and Rental and Leasing | 378 | 1,462 | $48,205 | $32,972 | -92 | -5.9% |
| Utilities | 46 | 1,347 | $160,461 | $119,125 | -165 | -10.9% |
| Mining | 20 | 143 | $7,946 | $55,568 | +17 | +13.5% |
| Source: DEED Quarterly Census of Employment and Wages (QCEW) | ||||||
As noted, with just over 18,500 job vacancies, Southeast Minnesota currently has the highest number of openings ever reported, while the 6,500 unemployed workers was the lowest number on record since 2001, leading to unprecedented tightness in the labor market. This has had profound effects on employers, as many are struggling to fill their open positions. Some have enhanced their desirability with increased wages, hiring bonuses, and flexible work schedules, and given stronger consideration to candidates who may have been overlooked, such as workers with disabilities, immigrants, and individuals with criminal backgrounds.
Unfortunately, many of the occupational groups that have higher numbers of vacancies are also among the lowest-paying, creating a crunch on the job seeker side as well. The top three occupational groups with the highest numbers of vacancies all had a median wage offer below $13.25 per hour, which falls about $0.25 below the median hourly wage required for a single person to meet the basic needs cost of living in Southeast Minnesota. Likewise, each parent in a typical household (two parents, one working full-time and one working part-time, with one child) would need to earn $15.81 per hour to meet a basic needs cost of living, meaning over half of the vacancies don't pay enough for workers to meet that threshold. This wage imbalance is also placing a strain on the labor market.
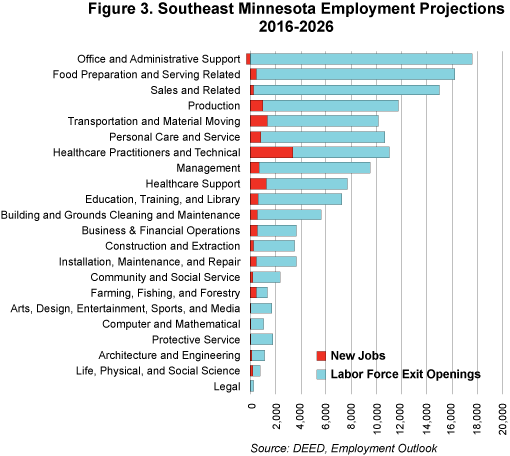
And while the labor market feels tight now, according to DEED's 2016 to 2026 employment projections, the demand for workers is only going to increase in the future. The region is expected to see about 310,000 total openings through 2026 due to both job growth and labor force exits, primarily retirements. Among those occupational groups projected to see the highest number of total openings are office and administrative support, food preparation and serving related, and sales and related. These groups are also among the lowest paying occupational groups.
Not surprisingly, the largest numeric growth (new jobs) is projected to be for health care practitioners and technical occupations in which there are anticipated to be just over 3,350 new jobs. The largest number of openings due to labor force exits is expected to be among office and administrative support occupations. Employers will need to work hard to attract and retain workers to fill all these jobs.
