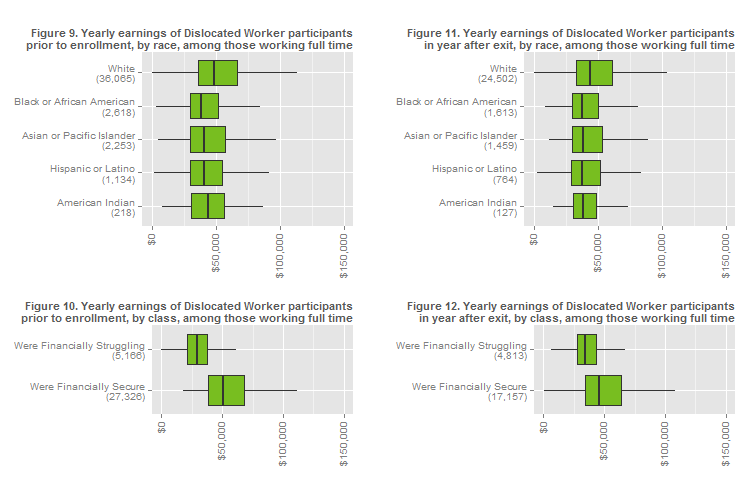
Figures 9 through 12 show the earnings distribution of Dislocated Worker participants. Each of these graphs shows earnings only among full-time workers to better isolate the earnings gap from the employment (and part-time employment) gap. Full-time employment could be one full-time, year-round job or multiple part-time or temporary jobs. Learn more about these wage boxplots in Appendix E.

A persistent wage gap by race and class exists among Dislocated Worker and Adult program participants, both before and after they participate in the program. This mirrors the income trends we see in the statewide labor market (See Note 1).
The median yearly earnings of full-time employed, white participants prior to enrollment is nearly $50,000, compared to the lowest median earnings of about $38,500 among their Black or African American counterparts (Figure 9). The median participant who was financially secure prior to participation earned over $51,000, compared to the median participant who was financially struggling (who earned about $29,000) (Figure 10).
In the first year after program exit, the median full-time employed white participant earned almost $45,000, compared to every other racial group, whose median earnings are between $38,000 and $39,000 (Figure 11). Again, the class disparity is larger. Among those who were financially secure prior to participation, median earnings are about $46,000 in the year after participation, while the median among those who were financially struggling is nearly $35,000 (Figure 12).
Because the earnings distributions shown here are among those working full time, they suggest a systematic difference by race and class in job quality rather than job availability. See Context on Racial and Class Employment Disparities for a discussion of some of the potential factors behind this difference.